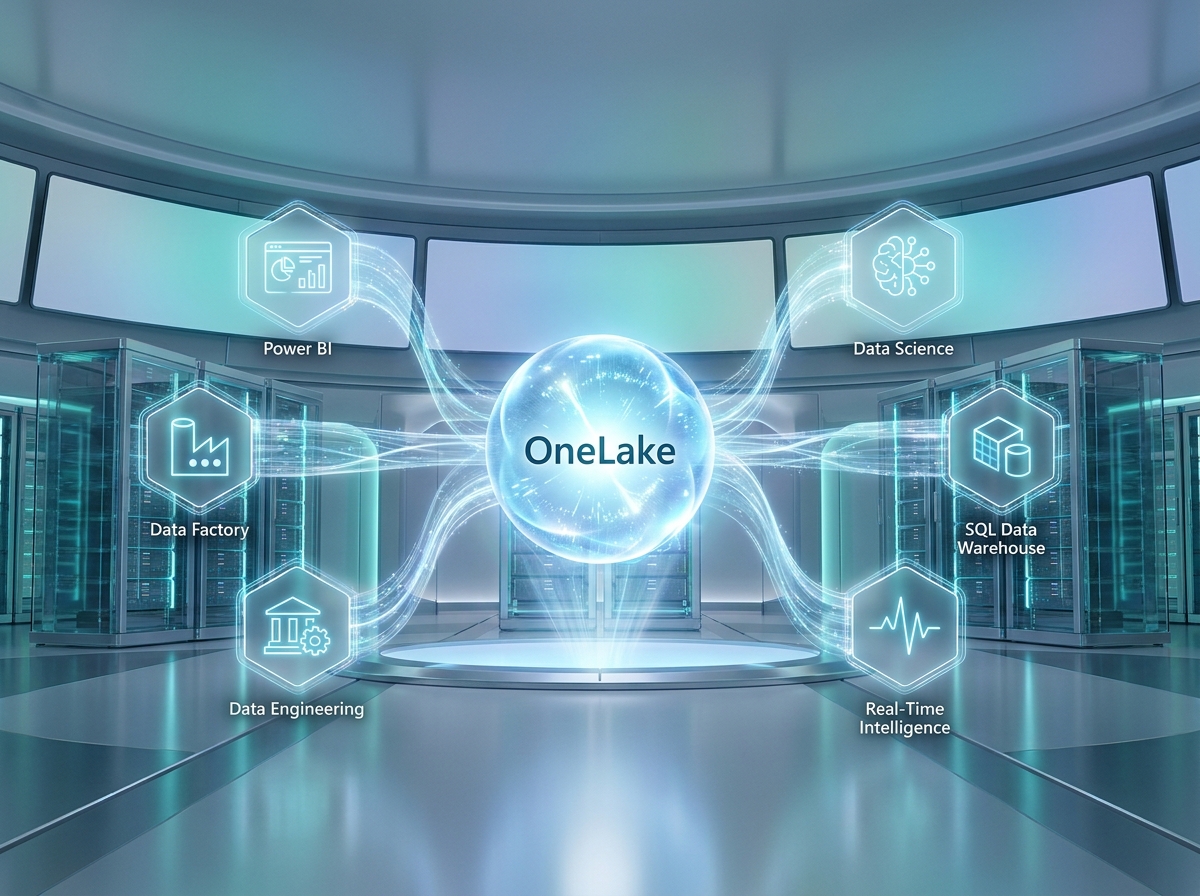
For years, building a complete analytics solution meant stitching together separate products: one tool to move data, another to store it, another to transform it, another for data science, another for the warehouse, and Power BI at the end for reporting. Each had its own service, its own copies of the data, its own bill, and its own learning curve. Microsoft Fabric collapses all of that into a single, unified platform where every workload shares one data lake and one governance model. For anyone who already knows Power BI, Fabric is the natural next horizon, and understanding it is fast becoming essential for modern data professionals.
Key Takeaways
- Microsoft Fabric is a unified, software-as-a-service (SaaS) analytics platform that brings data integration, engineering, science, warehousing, real-time analytics, and Power BI together in one environment.
- OneLake is Fabric’s single, tenant-wide data lake, one copy of data, in open Delta Parquet format, shared across every workload with no duplication.
- Fabric is organized into workloads, each specialized for a task but all operating over the same OneLake storage and governance layer.
- Power BI is not replaced by Fabric, it is a core workload within it, and existing Power BI skills carry directly across.
- Fabric is licensed through capacity, and its unified model is especially powerful for large, complex organizations such as healthcare networks that need to break down data silos.
This guide explains Microsoft Fabric from the ground up: what it is, why Microsoft built it, how its architecture and OneLake foundation work, what each workload does, how Power BI fits in, and how licensing works. It includes a detailed hospital digital-transformation case study showing Fabric unifying analytics across an entire healthcare network.
This article is part of the Zytriona Power BI learning series and serves as the bridge from Power BI into the wider Microsoft analytics ecosystem. It builds on What Is Power BI?, Power BI Service Explained, and Power BI Performance Optimization.
What Is Microsoft Fabric?
Microsoft Fabric is a unified, end-to-end analytics platform delivered as software-as-a-service (SaaS), bringing together every stage of the data journey, ingestion, storage, transformation, data science, warehousing, real-time analytics, and reporting, into a single integrated environment built on a shared data lake called OneLake.

The word “unified” is the key to understanding Fabric. Traditionally, an analytics stack was assembled from many distinct products, a data integration tool, a data lake, a Spark platform, a data warehouse, a streaming service, and a reporting tool, each bought, configured, and governed separately, with data copied between them. Fabric replaces that fragmented landscape with one platform where every capability is a “workload” operating over the same storage and governance layer.
Because it is delivered as SaaS, there is no infrastructure to provision or manage. You do not spin up servers or clusters; you simply use the workloads, and Microsoft handles the underlying compute and scaling. This is a significant shift from earlier platforms that required substantial setup and administration.
According to Microsoft’s official Fabric overview, the platform supports complete data workflows, from ingestion through to reporting, across integrated experiences that all share one compute and storage model. In short, Fabric aims to be the single place an organization does all of its analytics.
Why Microsoft Created Fabric
Fabric was created to solve a problem that had grown acute in modern data teams: fragmentation. Understanding the problem clarifies why Fabric is designed the way it is.
The cost of data silos. In the traditional stack, each tool held its own copy of the data. Data was copied from source to lake, from lake to warehouse, from warehouse to reporting. Every copy added cost, latency, and a chance for inconsistency, different tools showing different numbers for the same thing. These silos were a persistent drag on both efficiency and trust.
Integration overhead. Connecting all these separate tools, and keeping them connected as they each evolved, consumed enormous engineering effort. Teams spent more time maintaining plumbing than delivering insight.
Fragmented governance and security. With data spread across many systems, governing and securing it consistently was extremely difficult. Each tool had its own permissions model, making a coherent, organization-wide view of who could access what nearly impossible.
Skills fragmentation. Each tool demanded its own expertise. Building a complete solution required specialists in many different products, raising cost and complexity.
Fabric addresses all of these directly. One copy of the data in OneLake eliminates silos. One integrated platform removes most integration overhead. One governance and security layer spans every workload. And a consistent experience across workloads lowers the skills barrier. The motivation, in a sentence, was to let organizations spend their time on analytics rather than on assembling and maintaining an analytics stack.
The Evolution from Power BI to Fabric
Fabric did not appear from nowhere. It is the evolution of Power BI’s underlying platform, expanded to cover the entire analytics lifecycle. For Power BI users, this lineage is reassuring: Fabric is built on foundations you already know.
The Power BI Service, described in Power BI Service Explained, was already a SaaS platform with workspaces, datasets, sharing, and governance. Fabric takes that same SaaS foundation, the workspace model, the tenant, the security framework, and extends it to host not just reporting but data engineering, warehousing, data science, and real-time analytics as well.
This is why the transition feels natural rather than disruptive. Power BI workspaces become Fabric workspaces that can hold many more item types. The datasets you built become semantic models within Fabric. The concepts of publishing, sharing, and capacity carry across. Fabric essentially wraps the entire analytics stack in the SaaS experience that Power BI pioneered, which is why Microsoft positions Power BI as the entry point and Fabric as the destination.
For a Power BI professional, learning Fabric is therefore additive, not a restart. Your reporting, modeling, and Power Query skills remain fully relevant; Fabric simply gives you many more capabilities that surround and feed those reports.
Microsoft Fabric Architecture
Fabric’s architecture is best understood as three layers: the workloads at the top, the platform services in the middle, and OneLake as the storage foundation beneath everything.
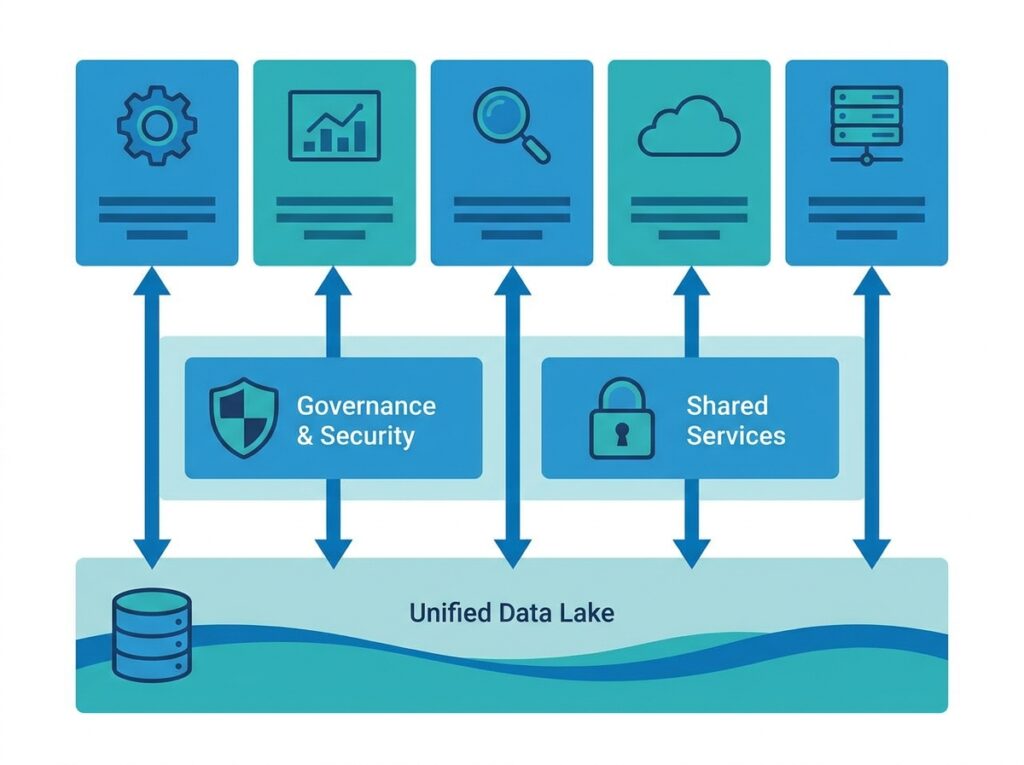
The workload layer sits at the top. These are the specialized experiences, Data Factory, Data Engineering, Data Science, Data Warehouse, Real-Time Intelligence, and Power BI, each tailored to a particular analytics task. A user works in whichever workload suits their job, but all of them operate within the same environment.
The platform layer sits in the middle, providing shared services used consistently across every workload: governance, security, the OneLake Catalog for discovering and governing data, and the workspace and capacity model. Because these services are shared, a governance or security policy applies uniformly, regardless of which workload created the data.
OneLake is the foundation. Every workload stores and reads its data through OneLake, so there is one copy of the data that all workloads can use, without copying it between systems. This “one copy” principle, often called zero-copy access, is the architectural heart of Fabric and the source of most of its advantages. The layers work together so that a data engineer, a data scientist, and a report author can all operate on the very same data, each through their preferred workload, with consistent governance throughout.
Understanding OneLake
OneLake is the single, unified, logical data lake that underpins all of Microsoft Fabric. It is automatically provisioned with every Fabric tenant and serves as the one place where all Fabric data lives, sometimes described as “the OneDrive for data.”
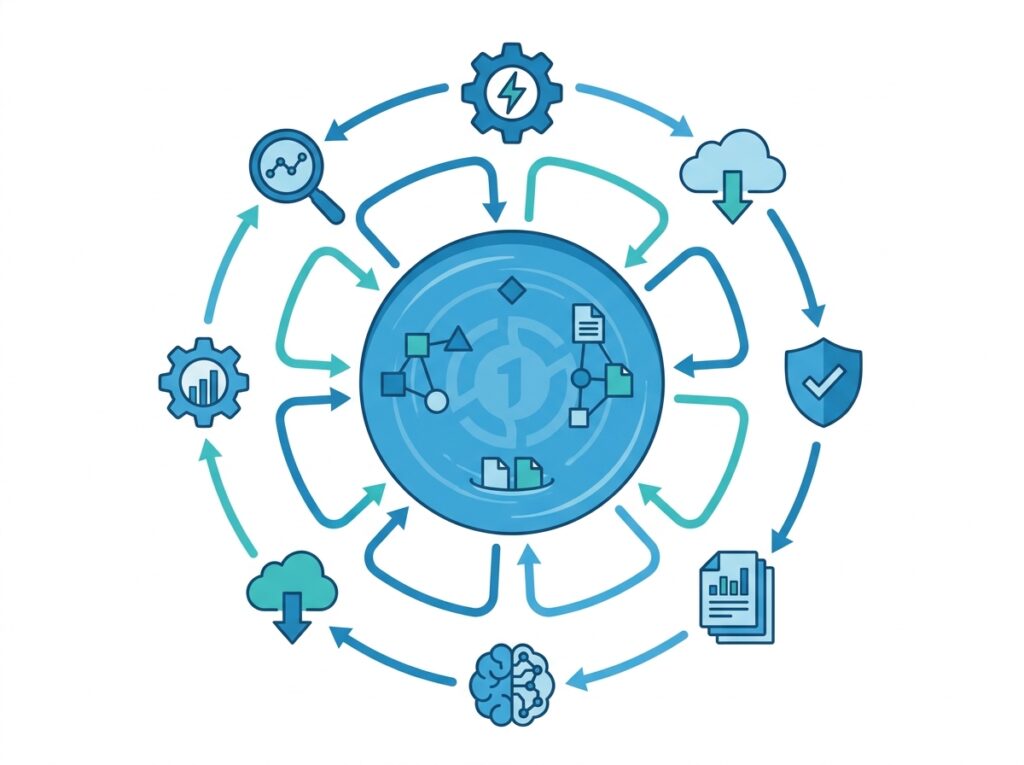
Several characteristics make OneLake central to Fabric’s value:
One copy, open format. OneLake stores data in an open format based on Delta Parquet, the same open table format used by Delta Lake. This means data written by one workload is instantly readable by another, no conversion, no copy. A table created by a data engineer in a Lakehouse is immediately available to a report author as a semantic model, and to a data scientist in a notebook, all pointing at the same underlying files.
Tenant-wide and organized. OneLake spans the whole organization, structured into workspaces and items, giving a coherent, discoverable data estate rather than scattered, disconnected stores. The OneLake Catalog helps users find and govern data across the tenant.
Shortcuts and Mirroring. OneLake can reference data that lives elsewhere without moving it. Shortcuts point to data in other locations, such as Azure Data Lake Storage or Amazon S3, so it appears in OneLake without being copied. Mirroring continuously replicates data from external databases, such as Azure SQL, Cosmos DB, Snowflake, or others, into OneLake in near real time, so operational data becomes analytics-ready with minimal effort.
Microsoft’s OneLake documentation details these capabilities. The essential idea to hold onto is that OneLake is what makes Fabric unified, one open copy of data, accessible to every workload, is the foundation everything else builds on.
Fabric Workloads Explained
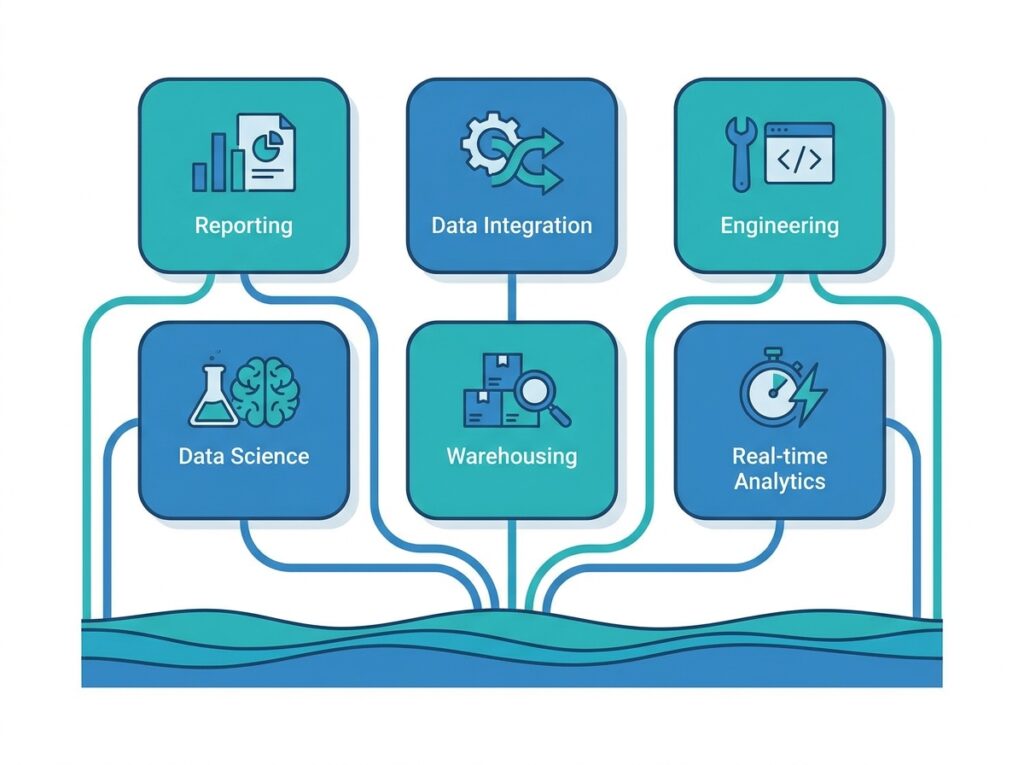
A workload in Fabric is a specialized set of capabilities aimed at a particular analytics task. Each workload is tailored to its users, data engineers, data scientists, analysts, report authors, yet all operate over the same OneLake data and shared governance. This is what lets a single platform serve many different roles.
| Workload | Purpose |
|---|---|
| Power BI | Reporting and visualization |
| Data Factory | Data integration and ingestion |
| Data Engineering | Spark-based transformation (Lakehouse) |
| Data Science | Machine learning and modeling |
| Data Warehouse | SQL analytics |
| Real-Time Intelligence | Streaming and event analytics |
The sections that follow explain each of these in turn. The unifying theme to keep in mind is that these are not separate products you integrate, they are experiences within one platform, all reading and writing the same OneLake data. Moving from one to another does not mean moving your data.
Power BI in Microsoft Fabric
Power BI is the reporting and visualization workload within Fabric, and for most organizations it is the most familiar entry point. Everything covered across the Zytriona Power BI series, reports, dashboards, DAX, data modeling, the Service, applies directly within Fabric.
What changes inside Fabric is how Power BI connects to data. Because reports can sit directly on OneLake data, Power BI gains a powerful new connectivity mode called Direct Lake. Direct Lake combines the speed of Import mode with the freshness of DirectQuery: it reads Delta Parquet data straight from OneLake without importing a copy and without the per-query source round-trips of DirectQuery. For large datasets, this can deliver fast performance on current data, an advance on the trade-offs described in Power BI Performance Optimization.
The datasets Power BI uses are known in Fabric as semantic models, the same modeling concepts, relationships, measures, and calculations from Power BI Data Modeling Explained, now sitting as first-class items in the unified platform. A semantic model built on OneLake data can serve reports while that same data simultaneously feeds a data science notebook or a warehouse query. Power BI in Fabric, in other words, is the Power BI you know, positioned as the presentation layer on top of a full analytics platform.
Data Factory
Data Factory is Fabric’s data integration workload, responsible for getting data into the platform and transforming it. It is where the analytics journey usually begins, ingesting data from the many sources an organization holds.
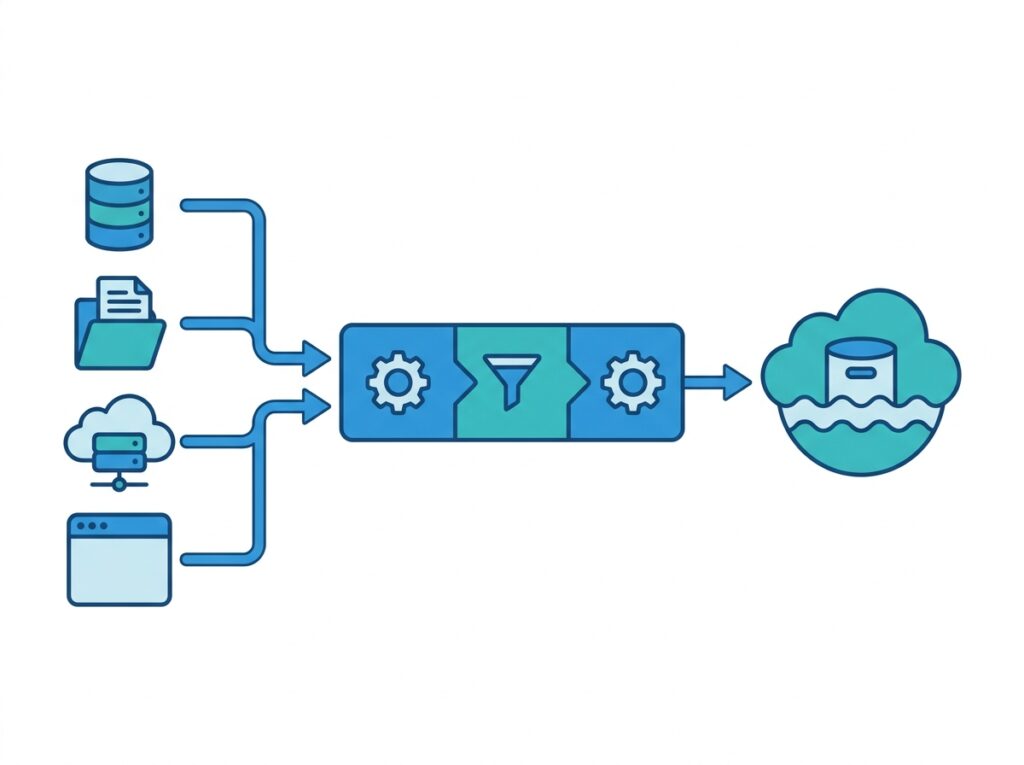
Data Factory offers two primary tools. Pipelines orchestrate the movement and processing of data, connecting to a very wide range of sources and coordinating multi-step ingestion and transformation workflows. Dataflows Gen2 bring the familiar Power Query experience, covered in Power Query in Power BI Explained, to platform-scale data preparation, so the transformation skills Power BI users already have apply directly here.
With hundreds of connectors, Data Factory can pull from cloud services, on-premises databases, files, and SaaS applications, landing the data in OneLake ready for the other workloads. Combined with Mirroring, which continuously replicates external databases into OneLake, Data Factory ensures that whatever an organization’s data sources are, the data can be brought into the unified platform efficiently. Microsoft’s Data Factory in Fabric documentation covers the full range of ingestion and orchestration capabilities.
Data Engineering
Data Engineering is the Fabric workload for large-scale data transformation using Apache Spark, centred on the Lakehouse. It is where raw ingested data is cleaned, shaped, and prepared at scale.
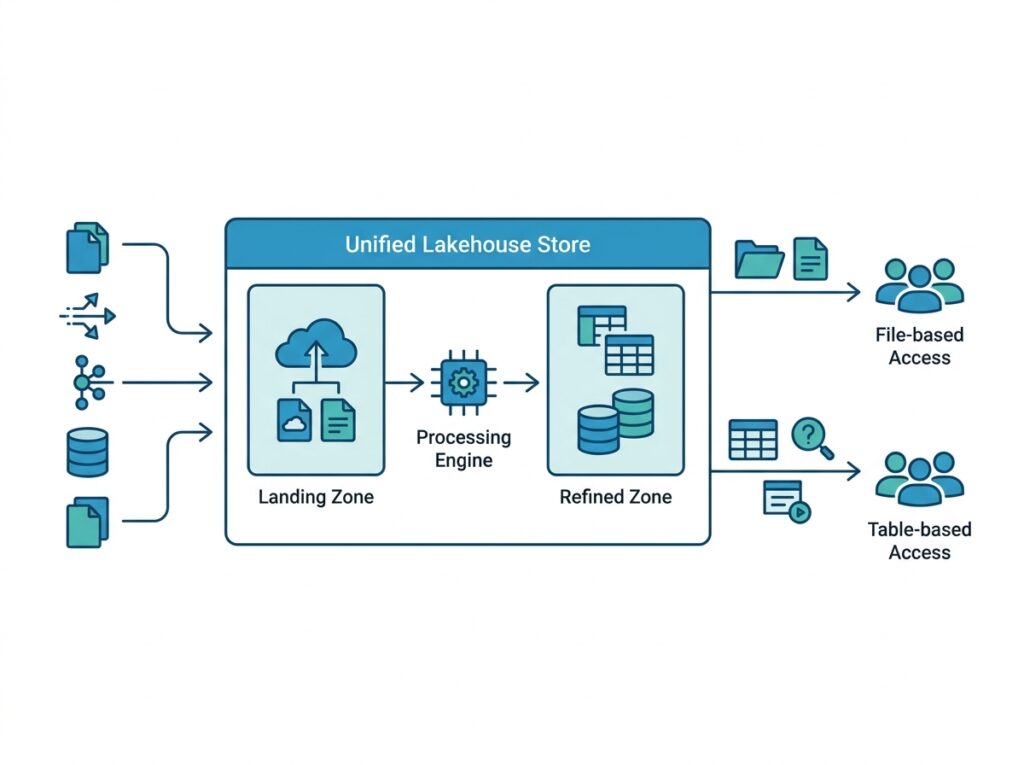
The central concept here is the Lakehouse, which combines the flexibility of a data lake (storing any type of raw data, structured or unstructured) with the structure and query capability of a data warehouse (organized tables you can query with SQL). A Lakehouse in Fabric stores its tables as Delta Parquet in OneLake, so they are simultaneously files a data engineer can process with Spark and tables an analyst can query, one store serving both worlds.
Engineers work in this environment primarily through notebooks, interactive documents that mix code (in languages such as PySpark, Spark SQL, and others), visualizations, and narrative. Backed by Fabric’s managed Apache Spark compute, notebooks let engineers transform very large datasets without provisioning or managing clusters. Every Lakehouse also exposes a SQL endpoint, so its Delta tables can be queried with standard SQL directly, making the engineered data immediately accessible to analysts and reporting. Data Engineering, in short, is where raw data becomes trustworthy, structured data ready for analysis, all within OneLake.
Data Science
The Data Science workload provides the tools to build, train, and deploy machine learning models directly on Fabric data, without moving it out of the platform. It brings predictive and advanced analytics into the same unified environment as reporting and engineering.
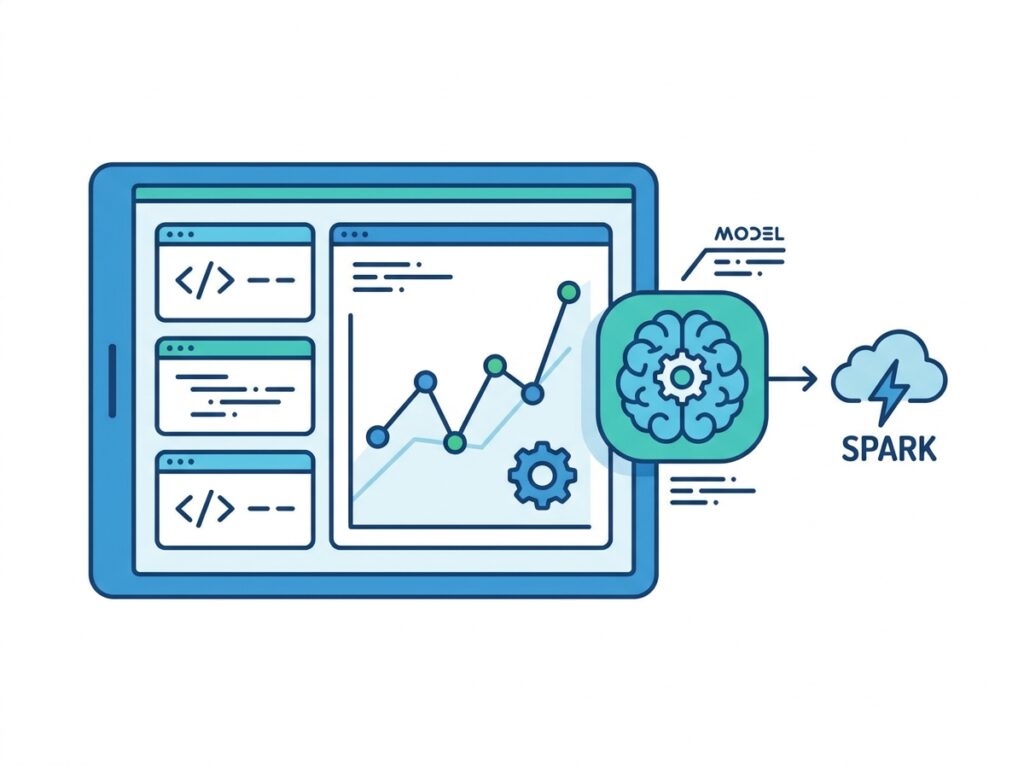
Data scientists work in notebooks, much like in Data Engineering, but focused on the machine learning lifecycle: exploring data, engineering features, training models, tracking experiments, and managing the resulting models. Fabric integrates common data science libraries and experiment-tracking capabilities so this whole lifecycle happens inside the platform.
The decisive advantage is proximity to the data. Because models train directly on OneLake data, there is no need to export data to a separate machine learning environment, a step that in traditional stacks added friction, cost, and governance risk. A model’s predictions can also be written back to OneLake, where they immediately become available to Power BI reports and every other workload. This closes the loop between advanced analytics and everyday reporting: a predictive model built by a data scientist can surface its outputs directly in an executive dashboard, all on the same governed data.
Data Warehouse
The Data Warehouse workload provides a full, SQL-based analytical warehouse experience within Fabric, offering the transactional guarantees and rich SQL support that many enterprise reporting and analytics scenarios require.
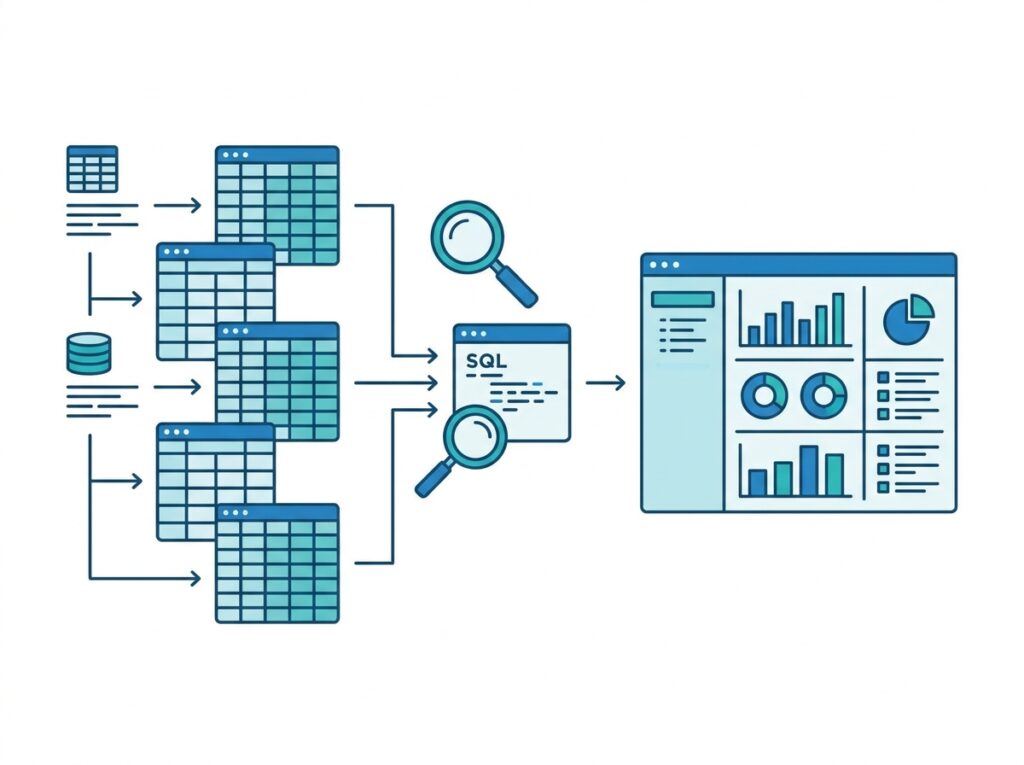
The distinction between the Warehouse and the Lakehouse is worth clarifying, since both store data in OneLake. The Lakehouse is oriented around data engineering with Spark and handles all data types, with SQL available for querying. The Warehouse is oriented around SQL, offering a traditional warehouse experience with full transactional (read and write) SQL support, suited to teams and workloads that are SQL-centric. Both keep their data as Delta tables in OneLake, so despite the different experiences, the data remains shared and open.
This gives organizations flexibility: SQL-focused teams can work in the Warehouse, Spark-focused teams in the Lakehouse, and both produce data into the same OneLake, feeding the same Power BI reports. The Warehouse brings decades of established SQL analytics practice into the unified Fabric platform without sacrificing the one-copy principle.
Real-Time Intelligence
Real-Time Intelligence is the Fabric workload for ingesting, analyzing, and acting on data in motion, streaming and event data that arrives continuously and must be processed as it happens rather than in scheduled batches.

Real-Time Intelligence brings together several capabilities for event-driven analytics. Eventstreams collect, transform, and route large volumes of streaming data from sources such as IoT sensors, application logs, and message systems, all without writing code. The data lands in an Eventhouse, which stores it in KQL databases optimized for fast queries over time-series and event data. Real-Time Dashboards then visualize this live data as it flows.
The capability that turns insight into action is Activator (Fabric’s event-detection engine). Activator continuously monitors streams and, when a defined condition or pattern is met, automatically triggers an action, sending an alert, kicking off a pipeline, or starting another workflow. This makes Fabric fundamentally event-driven: it can respond to conditions the moment they occur. Microsoft’s Real-Time Intelligence documentation details these components. For scenarios where seconds matter, monitoring critical equipment, detecting anomalies, tracking live operations, this workload provides capabilities that batch-oriented reporting simply cannot.
Industry Solutions
Beyond the general-purpose workloads, Microsoft offers industry-specific solutions built on Fabric, tailored data models, connectors, and capabilities for particular sectors such as healthcare, retail, and sustainability.
These industry solutions accelerate adoption by providing pre-built components suited to a sector’s common data and needs. In healthcare, for example, Fabric offers capabilities aligned to industry data standards and common healthcare data types, helping organizations bring clinical, operational, and administrative data together more quickly than building everything from scratch.
The value of these solutions is that they combine Fabric’s unified platform with domain-specific accelerators, so an organization in a regulated, data-complex industry can reach useful analytics faster while still benefiting from OneLake’s single-copy model and Fabric’s consistent governance. The hospital case study later in this guide illustrates the kind of transformation such a foundation enables.
Microsoft Fabric vs Power BI
A frequent question from Power BI users is how Fabric differs from Power BI, and whether Fabric replaces it. The clearest way to see the relationship is that Power BI is one workload within Fabric, the reporting layer, while Fabric is the entire platform surrounding it.
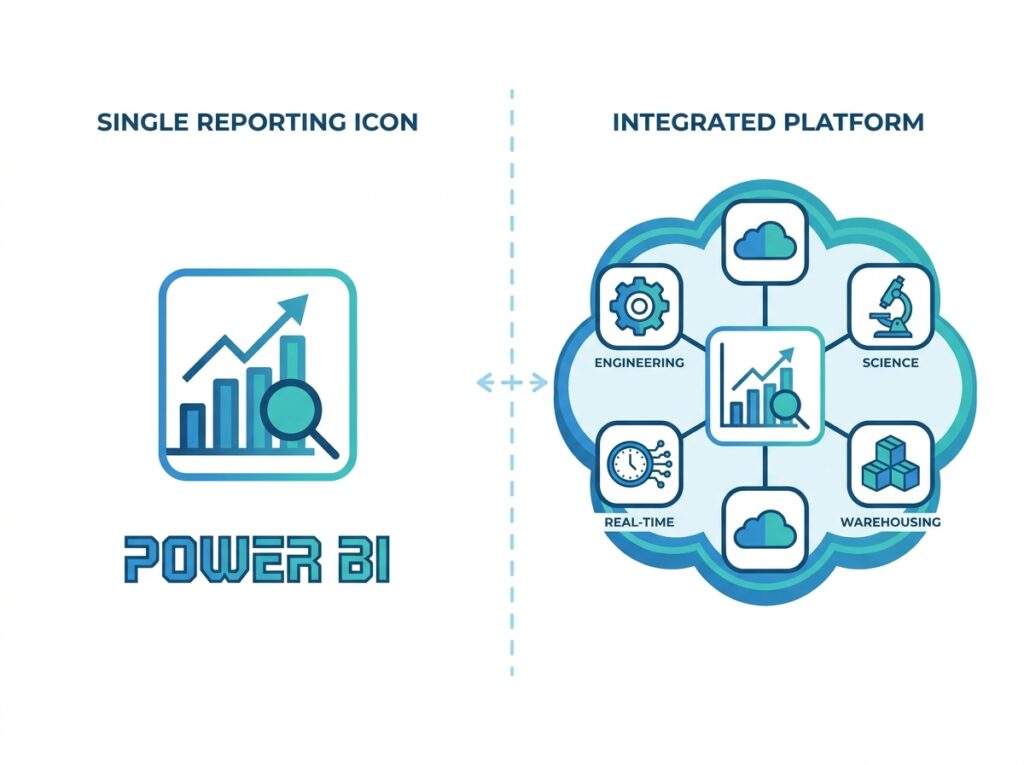
| Feature | Power BI | Microsoft Fabric |
|---|---|---|
| Visualization and reporting | Yes | Yes |
| Data engineering (Spark) | No | Yes |
| Data science / machine learning | No | Yes |
| Data warehouse | Limited | Yes |
| OneLake unified storage | No | Yes |
| Real-time analytics | Limited | Yes |
| End-to-end platform | No | Yes |
The practical takeaway is that Fabric does not replace Power BI, it contains it. If your need is purely reporting and visualization, Power BI alone remains entirely appropriate. Fabric becomes relevant when you also need the surrounding capabilities, ingestion, engineering, warehousing, data science, real-time, unified on one platform. For a Power BI professional, Fabric is an expansion of what is possible, not a replacement for the skills you have.
Microsoft Fabric vs Azure Synapse
Fabric is often compared with Azure Synapse Analytics, Microsoft’s earlier analytics platform, because they address overlapping needs. Understanding the difference clarifies why Fabric represents a step forward.
Azure Synapse is a powerful platform-as-a-service (PaaS) offering that brings together data warehousing and big-data analytics. As a PaaS product, however, it requires more provisioning, configuration, and management, you set up and manage pools and resources, and integrating it with reporting and other services involves deliberate engineering effort.
Fabric, by contrast, is delivered as SaaS and is unified by design. Where Synapse brought major capabilities together but still required significant setup and integration, Fabric provides an even broader set of workloads as a fully managed, ready-to-use platform, all sharing OneLake and one governance model out of the box. In essence, Fabric can be seen as the evolution of the ideas in Synapse into a simpler, more unified, SaaS-delivered form that also folds in Power BI and real-time analytics. For organizations weighing the two, Fabric is Microsoft’s clear strategic direction for unified analytics going forward, though the right choice for any specific situation depends on existing investments and requirements.
Microsoft Fabric Licensing
Fabric licensing is based on capacity, a pool of compute resources that powers all the workloads, rather than on per-feature or per-tool licensing. Understanding the model helps in planning a Fabric adoption.
Fabric capacity is purchased in units, historically expressed as capacity SKUs (for example, sizes labelled with an “F” followed by a number indicating the amount of capacity). This single capacity powers every workload, Data Factory, Data Engineering, Data Science, Data Warehouse, Real-Time Intelligence, and Power BI, drawing on the same shared pool. Capacity can typically be scaled up or down, and in many cases paused, to manage cost.
There is an important relationship with Power BI licensing, described in Power BI Service Explained. Fabric capacity relates to the Power BI Premium capacity model, and Power BI’s per-user licences (Free, Pro, Premium Per User) continue to play their role for report consumption. Larger Fabric capacities can enable broad content consumption similar to Premium capacity. Because licensing details, SKU names, and thresholds evolve over time, always confirm the current specifics against Microsoft’s official documentation before making purchasing decisions, this is one area where up-to-date verification genuinely matters. A free Fabric trial is generally available for those who want to explore the platform before committing to paid capacity.
Hospital Analytics Example
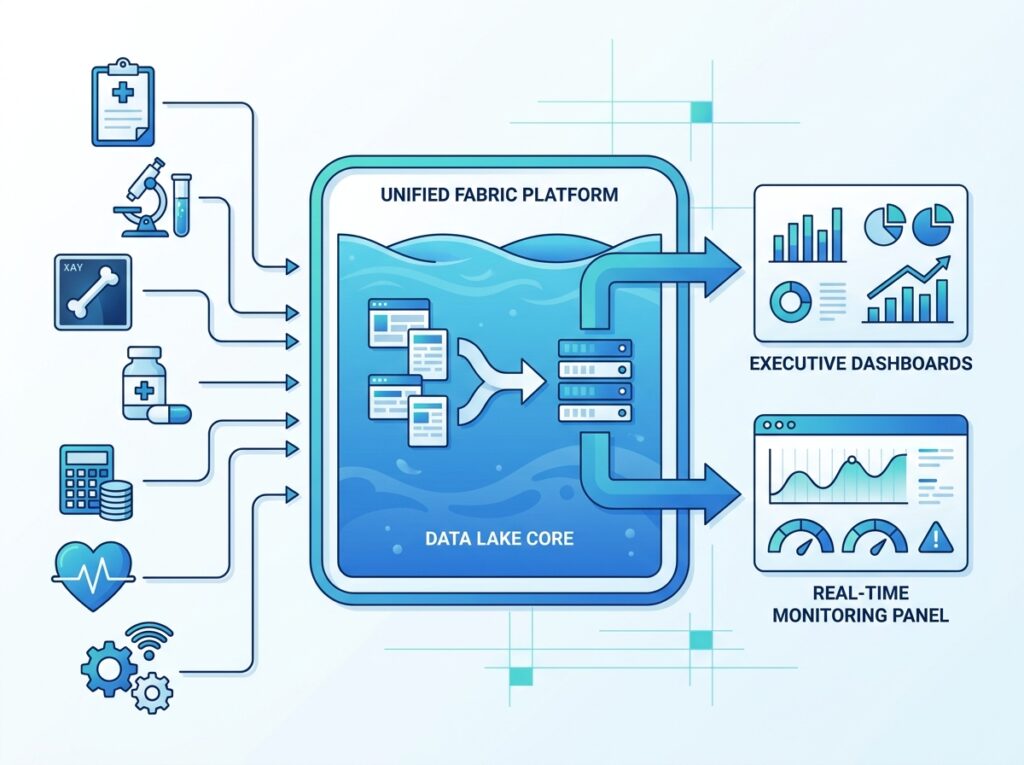
This section demonstrates Microsoft Fabric through a realistic, large-scale scenario: the digital transformation of a healthcare network’s analytics. It shows how Fabric’s unified platform resolves exactly the kind of fragmentation that plagues complex organizations, and why the one-copy, one-platform model is so valuable in a governance-critical setting.
The Organization
The healthcare network is large and data-rich:
- 40 hospitals
- 3,500 medical devices
- Electronic Health Records (EHR)
- Laboratory systems
- Radiology
- Finance
- Pharmacy
- Biomedical Engineering
- IoT sensor data from monitored equipment
Before Fabric
Each of these systems lived in its own world. The EHR had its database, the lab another, radiology another, finance and pharmacy their own, and biomedical maintenance yet another, with IoT sensor data flowing into something else entirely. Each had separate reporting, and combining data across them meant painful, manual, error-prone integration. The consequences were familiar: entrenched data silos, multiple disconnected reporting systems, inconsistent numbers between departments, and slow analytics that could not keep pace with operational needs. Answering a question that spanned departments, say, correlating equipment reliability with patient throughput, was enormously difficult.
After Fabric
Adopting Fabric restructures the entire analytics landscape around one platform:
- OneLake stores everything. All data, clinical, operational, financial, and sensor, lands in one unified lake in open format, ending the silos.
- Data Factory ingests the data. Pipelines and Mirroring bring data in from the EHR, lab, radiology, finance, pharmacy, and biomedical systems into OneLake, continuously and reliably.
- The Lakehouse stores raw data. Data Engineering with Spark cleans and shapes the raw incoming data into trustworthy, structured tables.
- The Data Warehouse powers reporting. Curated, SQL-ready data feeds consistent, governed reporting across the network.
- Power BI builds the dashboards. Using the skills from How to Build Your First Power BI Dashboard, analysts build departmental and executive dashboards on the unified data.
- Real-Time Intelligence monitors ICU sensors. Eventstreams ingest live IoT data from critical equipment, and Activator raises immediate alerts when readings breach safe thresholds.
- Executives access a single analytics platform. Leadership sees the whole network through one governed, consistent analytics environment rather than a patchwork of disconnected reports.
The Result
The transformation delivers exactly what fragmentation had denied: unified analytics across every department and hospital, faster reporting because data no longer has to be manually reconciled, better governance because one platform enforces consistent security and access (the row-level security principles from Power BI Row-Level Security now applied on unified data), and ultimately improved decision-making because leaders can finally see across the whole organization on trustworthy, current data. Combining biomedical maintenance data with clinical and operational data, once nearly impossible, becomes straightforward when everything lives in OneLake. This is the practical promise of Fabric realized in a setting where the stakes are genuinely high.
Microsoft Fabric Best Practices
Start with a clear use case, not the whole platform. Fabric is vast. Begin with one well-defined scenario, often extending existing Power BI reporting, and expand into more workloads as you build confidence.
Design your OneLake structure deliberately. Plan workspaces, Lakehouses, and naming conventions up front. A thoughtful structure keeps the unified data estate discoverable and governable as it grows.
Leverage the one-copy principle. Avoid unnecessary data duplication. Use Shortcuts and Mirroring to bring data into OneLake without copying, and let workloads share the same tables rather than re-importing them.
Establish governance and security early. Use the shared governance layer, Microsoft Entra ID for identity, the OneLake Catalog for discovery, and integration with Microsoft Purview for cataloguing and compliance, from the start rather than retrofitting it.
Build on your Power BI foundation. Your existing Power BI, data modeling, and Power Query skills transfer directly. Use them as the anchor while learning the surrounding workloads.
Manage capacity actively. Monitor capacity usage, scale to match real demand, and pause capacity where the workload pattern allows, to control cost.
Explore Copilot in Fabric. Fabric includes Copilot, AI assistance that can help generate code, build queries, create measures, and accelerate development across workloads. Used well, it lowers the barrier to the less familiar workloads.
Common Mistakes
Treating Fabric as just “new Power BI.” Fabric is a full analytics platform. Approaching it as only a reporting tool means missing most of its value, the ingestion, engineering, warehousing, science, and real-time capabilities that surround Power BI.
Duplicating data unnecessarily. Copying data between workloads defeats the one-copy principle. Failing to use Shortcuts, Mirroring, and shared OneLake tables reintroduces exactly the silos Fabric exists to remove.
Neglecting governance until later. Because Fabric spans so much, ungoverned sprawl accumulates quickly. Not establishing security, cataloguing, and naming conventions early creates a mess that is hard to untangle.
Ignoring capacity management. Since one capacity powers all workloads, unmonitored heavy use in one area can affect others and drive up cost. Not tracking capacity is a common and avoidable mistake.
Trying to adopt everything at once. Attempting to roll out every workload simultaneously overwhelms teams. Incremental adoption, starting from a familiar foothold, succeeds far more often.
Assuming licensing details from memory. Fabric’s capacity SKUs and licensing evolve. Planning on out-of-date assumptions leads to sizing and budget errors, always verify current specifics with Microsoft.
Conclusion
Microsoft Fabric represents the consolidation of the entire analytics stack into one unified, SaaS platform. By building everything on OneLake, a single open copy of data shared across every workload, Fabric eliminates the silos, integration overhead, and fragmented governance that have long burdened data teams. Its workloads, Data Factory, Data Engineering, Data Science, Data Warehouse, Real-Time Intelligence, and Power BI, each serve a specialized purpose while operating over the same data and governance.
For Power BI professionals, Fabric is the natural next step. It does not replace Power BI; it embraces it as the reporting layer of a much larger platform, and every skill you have built carries directly across. The hospital case study shows what becomes possible when a complex organization unifies its data: analytics that were once impractical become routine, and decisions once made on fragmented information are made on a single, trusted view.
If you have mastered Power BI fundamentals, security, deployment, and performance, Fabric is where that expertise expands into the modern enterprise data platform. Start from your Power BI foundation, explore one adjacent workload, and build outward. As Microsoft continues to position Fabric at the centre of its analytics strategy, understanding it is quickly becoming essential, and you are already well prepared to begin.
Frequently Asked Questions
Microsoft Fabric is a unified, end-to-end analytics platform delivered as software-as-a-service (SaaS). It brings together data integration, data engineering, data science, data warehousing, real-time analytics, and Power BI reporting into one environment, all built on a shared data lake called OneLake, so every workload operates on the same data with consistent governance.
No. Fabric does not replace Power BI, it includes it. Power BI is the reporting and visualization workload within the broader Fabric platform. All existing Power BI skills, reports, dashboards, DAX, and data modeling, apply directly within Fabric. If you only need reporting, Power BI alone remains appropriate; Fabric adds the surrounding data capabilities.
OneLake is the single, unified, logical data lake at the foundation of Microsoft Fabric, automatically provisioned with every tenant. It stores all Fabric data in an open Delta Parquet format, so one copy of the data is shared across every workload without duplication. It is often described as the OneDrive for data, and it is what makes Fabric truly unified.
A Lakehouse is a Fabric item that combines the flexibility of a data lake (storing any raw data, structured or unstructured) with the structure and query ability of a data warehouse (organized tables queryable with SQL). In Fabric, a Lakehouse stores its tables as Delta Parquet in OneLake, so the same data is available both as files for Spark processing and as SQL-queryable tables.
Fabric is a paid platform licensed through capacity, but a free trial is generally available so you can explore it before committing. Power BI’s own free and Pro per-user licences continue to exist for report consumption. For production use, Fabric requires purchased capacity; because pricing and SKUs change, confirm current details with Microsoft’s official documentation.
Fabric suits organizations that need more than reporting alone, those that also require data ingestion, engineering, warehousing, data science, or real-time analytics, unified on one governed platform. It is especially valuable for larger, data-complex organizations aiming to break down silos. Power BI developers, data engineers, data scientists, BI managers, and enterprise architects all work within it.
Power BI is a core workload within Fabric, serving as the reporting and visualization layer. Because Power BI reports can sit directly on OneLake data, Fabric enables Direct Lake mode, combining Import-like speed with current data. Power BI datasets become semantic models in Fabric. Everything you know about Power BI applies, now on top of a full analytics platform.
Fabric’s core workloads are Power BI (reporting), Data Factory (data integration), Data Engineering (Spark and Lakehouse), Data Science (machine learning), Data Warehouse (SQL analytics), and Real-Time Intelligence (streaming and event analytics). All operate over the same OneLake storage and shared governance, and Microsoft continues to add capabilities to the platform over time.
Yes. Fabric is well suited to healthcare, where data is typically spread across many systems, EHR, lab, radiology, pharmacy, finance, biomedical, and IoT sensors. Its unified OneLake foundation breaks down these silos, its shared governance supports the strict security healthcare requires, and Real-Time Intelligence can monitor live equipment data. Microsoft also offers healthcare-specific industry solutions built on Fabric.