
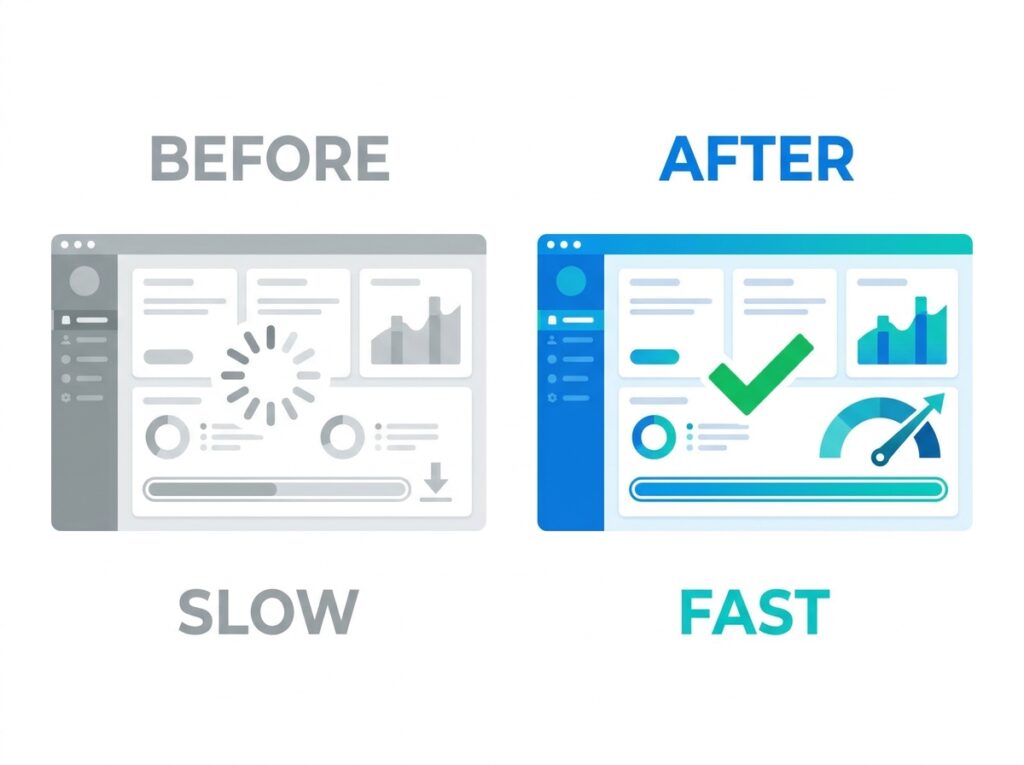
If a report takes 35 seconds to load, people stop opening it. The data might be accurate, the visuals well-designed, the insights truly valuable, but if an executive clicks on a dashboard and just keeps staring at spinning circles, confidence drops with every second. Performance isn’t just a technical feature; it determines whether all the hard work behind a Power BI solution actually gets used or not. The good news is that slow Power BI reports usually have recognizable and fixable causes, and this guide provides a complete toolkit to find and fix them.
Key Takeaways
- Most slow Power BI reports are caused by a poor data model, inefficient DAX, or too many visuals, not by data volume alone.
- A clean star schema is the single most important performance factor, because Power BI’s VertiPaq engine is optimized for it.
- Reducing column cardinality, removing unused columns, and preferring measures over calculated columns shrink the model and speed everything up.
- Performance Analyzer, DAX Studio, and VertiPaq Analyzer are the three tools that turn guesswork into precise diagnosis.
- A structured optimization pass, model, DAX, visuals, refresh, can take a dashboard from thirty-plus seconds to under five.
Performance optimization is what separates a Power BI solution that scales gracefully from one that grinds to a halt as data and users grow. For anyone building analytics at an organizational scale, it is an essential discipline and one that brings together nearly every other Power BI skill.
This article is part of the Zytriona Power BI learning series. It draws on Power BI Data Modeling Explained, Beginner’s Guide to DAX in Power BI, Power Query in Power BI Explained, and Power BI Incremental Refresh. If you are new to the platform, start with What Is Power BI?
What Is Power BI Performance Optimization?
Power BI performance optimization is the practice of tuning a data model, its DAX calculations, its queries, and its visuals so that reports and dashboards load and respond as quickly as possible. It spans the entire solution, from how data is shaped in Power Query to how a final visual renders on screen.

At its heart, optimization is about doing less work to produce the same result. A slow report is usually doing far more than it needs to, scanning columns it does not use, recalculating values it could store, or rendering more visuals than the eye can absorb. Optimization identifies that wasted work and removes it.
Understanding one component is central to everything that follows: the VertiPaq engine. VertiPaq is the in-memory, columnar storage engine that powers Power BI’s Import mode. It compresses data column-by-column and stores it in memory for extremely fast querying. Almost every model-level optimization technique works by helping VertiPaq compress better and scan less, which is why understanding it underpins effective performance tuning. Microsoft’s performance optimization guidance provides the authoritative reference for these techniques.
Why Performance Matters
Performance is not a purely technical concern, it directly shapes whether a Power BI solution delivers value. The consequences of poor performance are felt across the organization.
Adoption depends on speed. Users abandon slow reports. A dashboard that takes half a minute to load will be opened less and less until it is effectively unused, no matter how good its content. Fast reports get used; slow ones get ignored.
Decisions depend on responsiveness. Business intelligence exists to support decisions. When every filter click means a ten-second wait, the exploratory analysis that drives good decisions simply does not happen. Responsiveness enables the interactive thinking that is the whole point of BI.
Cost and capacity. Inefficient models consume more memory and processing capacity. At enterprise scale, this translates directly into higher capacity requirements and cost. A well-optimized model does more within the same capacity.
Reliability. Heavy, inefficient models are more prone to refresh failures and timeouts. Optimization improves not just speed but the overall stability of the solution.
Common Causes of Slow Power BI Reports
Before optimizing, it helps to know where slowness typically originates. In practice, most performance problems trace back to a small number of recurring causes.
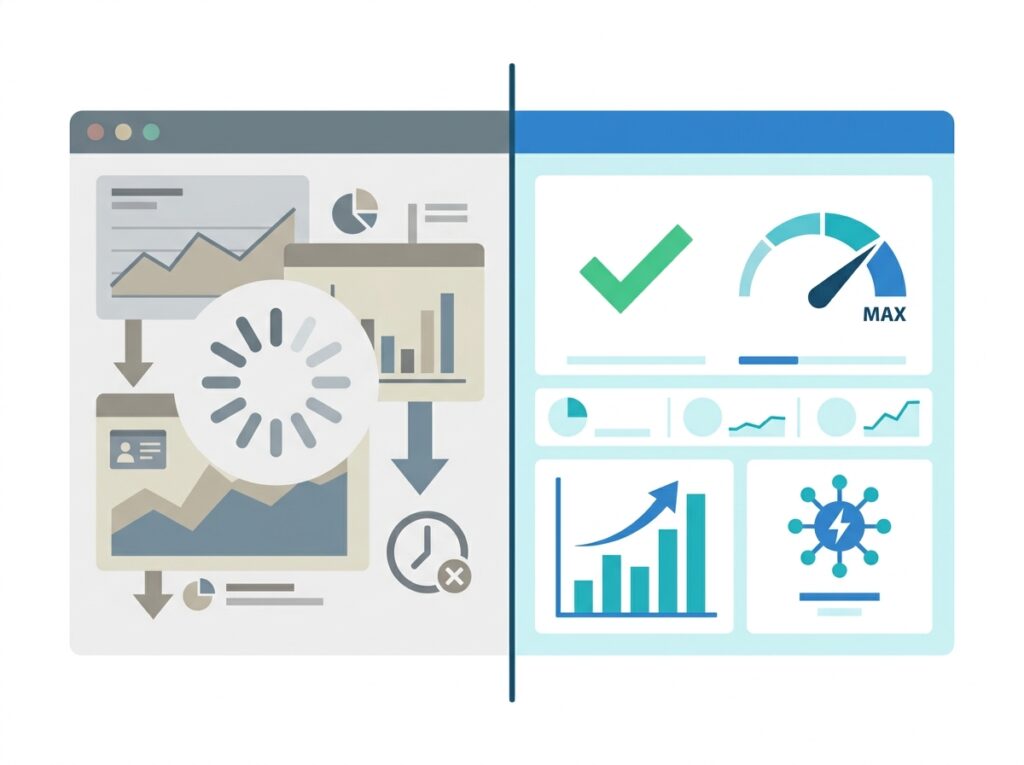
- A poor data model. Flat single-table models, snowflake chains, and unnecessary columns force VertiPaq to work harder than it should. This is the most common root cause.
- High-cardinality columns. Columns with many unique values, such as precise timestamps or free-text IDs, compress poorly and bloat the model.
- Inefficient DAX. Measures that iterate unnecessarily, misuse context, or rely on heavy calculated columns slow every visual that uses them.
- Too many visuals per page. Each visual issues its own query. A page with twenty-five visuals fires twenty-five queries on load.
- Broken query folding. When transformations do not fold to the source, Power BI pulls more data than necessary and processes it locally.
- Full refresh of large tables. Reloading all history on every refresh, rather than using Incremental Refresh, strains both refresh time and resources.
The encouraging reality is that these causes are all addressable. The rest of this guide works through each one in turn.
Optimizing Your Data Model
The data model is where the largest performance gains are found. Because VertiPaq’s efficiency depends directly on model structure, getting the model right delivers benefits that ripple through every measure and every visual.
Use a Star Schema
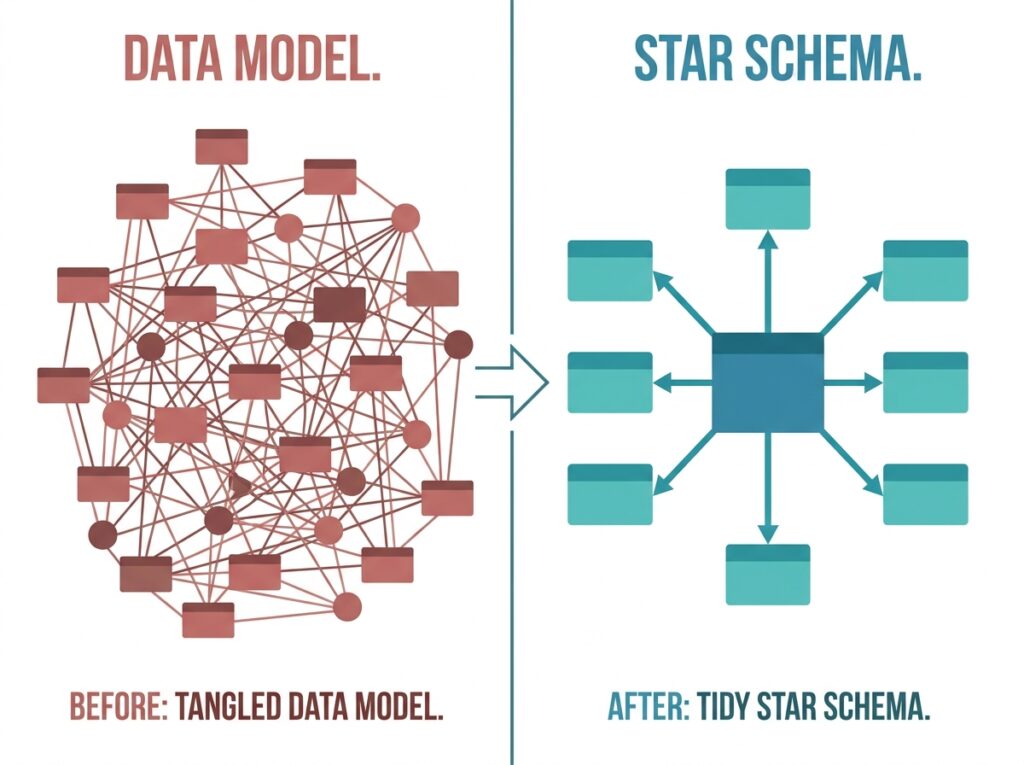
A clean star schema, a central fact table surrounded by dimension tables, is the single most important structural factor for performance. VertiPaq is optimized for this shape, and filters propagate through it efficiently. As detailed in Power BI Data Modeling Explained, converting flat or snowflake models into a star schema is often the highest-impact optimization available.
Remove Unnecessary Columns
Every column loaded into the model consumes memory, whether or not any report uses it. Removing columns that are not referenced in any report shrinks the model and speeds up refreshes and queries. Load only the columns your reporting genuinely needs, and remove the rest in Power Query.
Reduce Column Cardinality
Cardinality, the number of unique values in a column, is one of the biggest drivers of model size, because VertiPaq compresses low-cardinality columns far more effectively. A datetime column with second-level precision might have millions of unique values; splitting it into a date column and a separate time column dramatically reduces cardinality and improves compression. Avoid storing high-precision or free-text columns where a lower-cardinality alternative would serve.
Optimize Relationships and Keys
Build relationships on compact integer keys rather than long text columns, and keep relationships single-direction wherever possible. Bidirectional relationships add overhead and can complicate query evaluation. These modeling choices, covered in depth in the data modeling guide, directly affect how quickly filters resolve.
Optimizing Power Query
Performance optimization begins before data even reaches the model, in the Power Query transformations that prepare it. The key concept here is query folding.
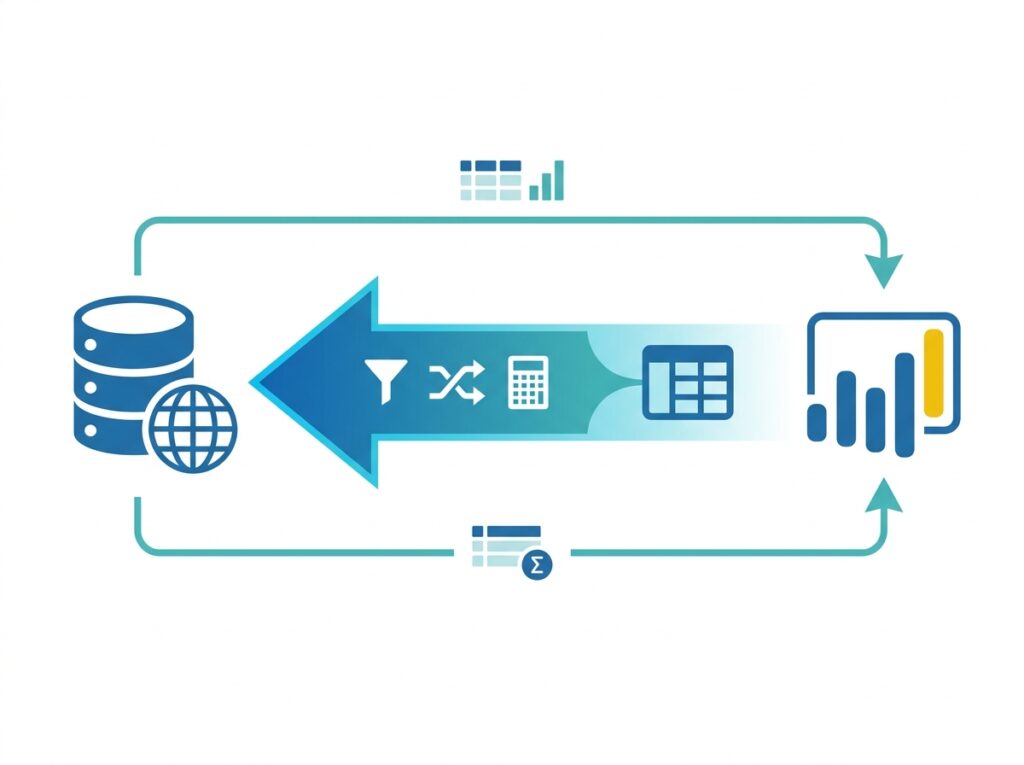
Query folding, explained fully in Power Query in Power BI Explained, is when Power Query translates transformation steps into a native query that the source database executes. When folding works, the database does the heavy lifting, filtering, aggregating, and selecting, and Power BI receives only the result it needs. When a fold breaks, Power BI must pull all the raw data and process it locally, which is much slower.
To optimize Power Query for performance: apply filters and column removals as early as possible so less data flows through subsequent steps, keep transformations foldable by favoring native operations over complex custom logic, and verify folding is preserved by checking for the “View Native Query” option on your steps. Preserving query folding also makes Incremental Refresh work efficiently, which ties directly into large-dataset performance.
Optimizing DAX Measures
DAX is where a great deal of performance is won or lost. Inefficient measures slow every visual that uses them, while well-written ones let VertiPaq do what it does best.
Prefer Measures Over Calculated Columns
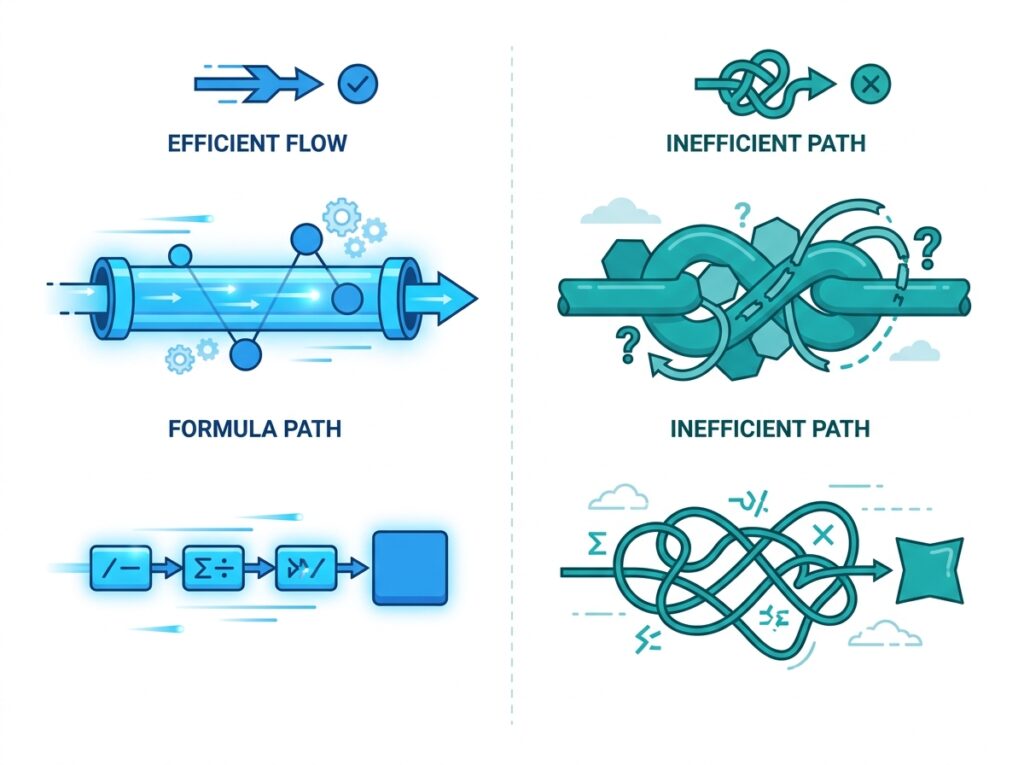
Calculated columns are computed row by row and stored in the model, consuming memory and increasing size. Measures are computed on demand and stored only as formulas. For most aggregation and analytical logic, measures are both leaner and faster. The distinction, covered in the Beginner’s Guide to DAX in Power BI, has direct performance implications.
| Feature | Calculated Column | Measure |
|---|---|---|
| Stored in model | Yes | No (formula only) |
| Memory usage | Higher | Lower |
| Performance | Slower for large models | Better |
| Dynamic (responds to filters) | No | Yes |
Write Efficient DAX
Favor simple aggregations over complex iterators where possible, since functions that scan tables row by row are more expensive than direct column aggregations. Use variables to avoid recalculating the same expression multiple times within a measure. Avoid unnecessary nesting and repeated context transitions. And use DIVIDE rather than the division operator for safe, efficient division. Small improvements in a frequently used base measure compound across every visual that depends on it.
Optimizing Report Visuals
The report canvas itself is a major, and often overlooked, performance factor. Every visual on a page generates its own query against the model, so the number and complexity of visuals directly affects load time.
Reduce the number of visuals per page. This is one of the most effective visual-level optimizations. A page with eight well-chosen visuals loads far faster than one with twenty-five. As covered in 10 Power BI Dashboard Best Practices, fewer, more focused visuals also communicate more clearly, so this optimization improves both speed and usability at once.
Beyond reducing count, limit the number of fields and data points in each visual, avoid highly complex custom visuals when a native one would suffice, and turn off unnecessary interactions between visuals so that a single click does not trigger a cascade of cross-filtering queries. Avoid placing very high-cardinality fields directly on visual axes, which forces rendering of a large number of data points.
Managing Large Datasets
As datasets grow into the millions of rows, specific techniques become essential to maintain acceptable performance. The foundational technique is Incremental Refresh.
Incremental Refresh, covered comprehensively in Power BI Incremental Refresh, partitions a large table by date and refreshes only the recent portion, leaving historical data cached. This transforms refresh performance for large tables, reducing refresh time from hours to minutes and easing load on both Power BI and the source system.
Beyond Incremental Refresh, large-dataset performance benefits from aggregation tables, pre-summarized tables that answer common queries without scanning the full detail, and from careful attention to what level of detail the reports actually require. Storing and querying data at the grain the reports need, rather than the finest grain available, avoids a great deal of unnecessary work. For the very largest scenarios, Premium or Fabric capacity provides higher memory limits and more advanced storage options.
Import Mode vs DirectQuery Performance
Storage mode has a fundamental impact on performance, and choosing the correct one is a key optimization decision. The two primary modes, Import and DirectQuery, behave very differently.
Import mode loads data into VertiPaq’s in-memory engine, delivering very fast query performance because everything is held in compressed memory. It is the default and, for most analytical reporting, the fastest option. DirectQuery leaves the data in the source and queries it live with each interaction, avoiding data copy and enabling near-real-time data, but its speed depends entirely on the source system’s performance and it typically cannot match Import mode’s responsiveness.
| Feature | Import | DirectQuery |
|---|---|---|
| Speed | Faster | Depends on source |
| Memory usage in Power BI | Higher | Lower |
| Real-time data | No | Yes |
| Best for analytics | Yes | Sometimes |
| Enterprise reporting | Yes | Depends |
The practical guidance: prefer Import mode for performance unless you have a specific need for real-time data or a dataset too large to import. Microsoft’s storage mode guidance details the trade-offs, including composite models, which blend Import and DirectQuery to balance freshness and speed. When DirectQuery is required, optimizing the source database itself becomes central to Power BI performance.
Performance Analyzer Explained
Effective optimization starts with measurement, not guesswork. Power BI Desktop includes a built-in tool for exactly this: Performance Analyzer.
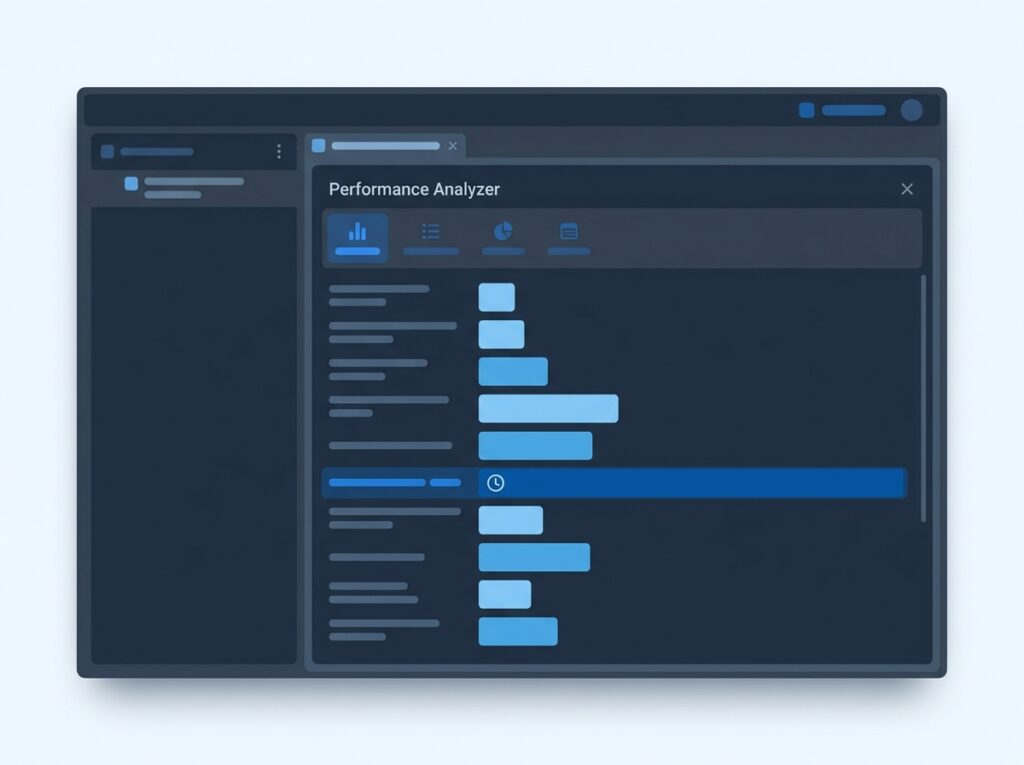
Performance Analyzer, found on the View ribbon in Power BI Desktop, records exactly how long each visual takes to render and breaks that time down into its components, the DAX query, the visual display, and other operations. Microsoft’s Performance Analyzer documentation covers its full use.
To use it: start recording, interact with the report as a user would, and review the timings. The visual with the longest duration is your first optimization target, and the breakdown tells you whether the delay is in the DAX query, the rendering, or elsewhere. This removes all guesswork, instead of optimizing everything indiscriminately, you fix the specific visual and the specific cause that is actually slowing the report. It is the essential starting point for any serious optimization effort.
Using DAX Studio for Performance Analysis
For deeper DAX and query analysis, DAX Studio is the tool of choice among Power BI professionals. It is a free, external tool that connects to your Power BI model and provides detailed insight into how queries execute.
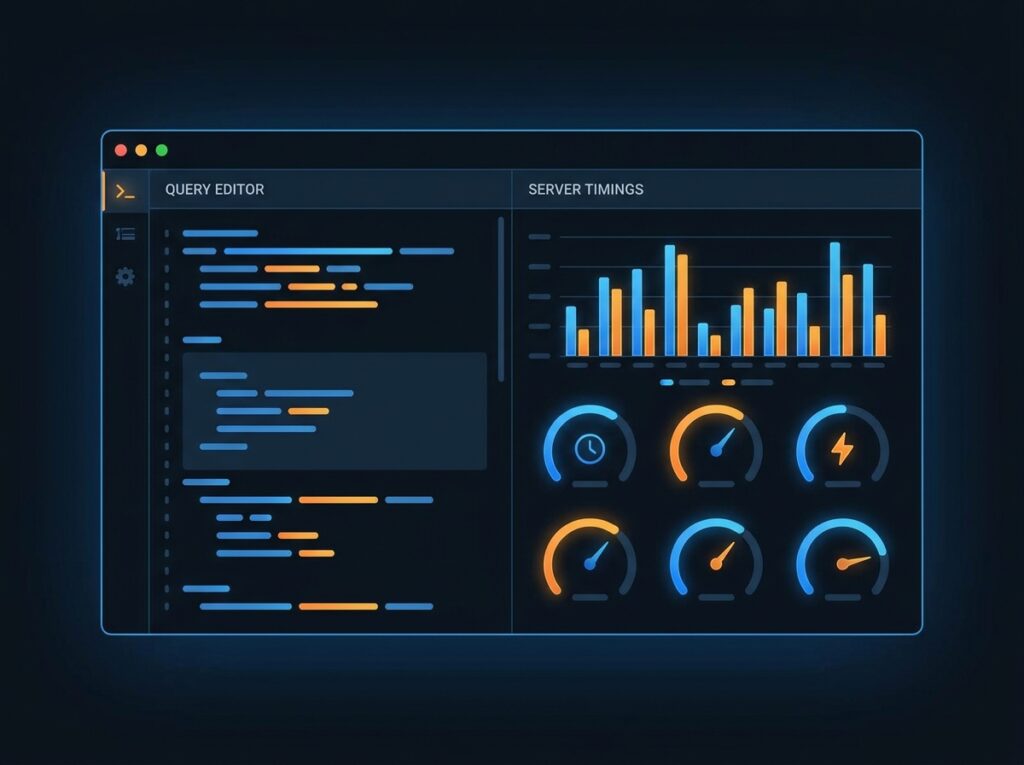
DAX Studio, available from the official DAX Studio website, lets you capture the queries generated by your visuals, run them in isolation, and examine detailed server timings, including how much time is spent in the storage engine versus the formula engine. This distinction is invaluable, it tells you whether a slow measure is limited by data scanning or by calculation logic, pointing directly to the right fix.
For anyone optimizing DAX seriously, DAX Studio moves the process from trial and error to precise, evidence-based tuning. You can test a measure rewrite, run it, and see immediately whether it is genuinely faster, rather than guessing.
Using VertiPaq Analyzer
While Performance Analyzer examines visuals and DAX Studio examines queries, VertiPaq Analyzer examines the model itself, showing exactly what is consuming memory and where the model can be trimmed.
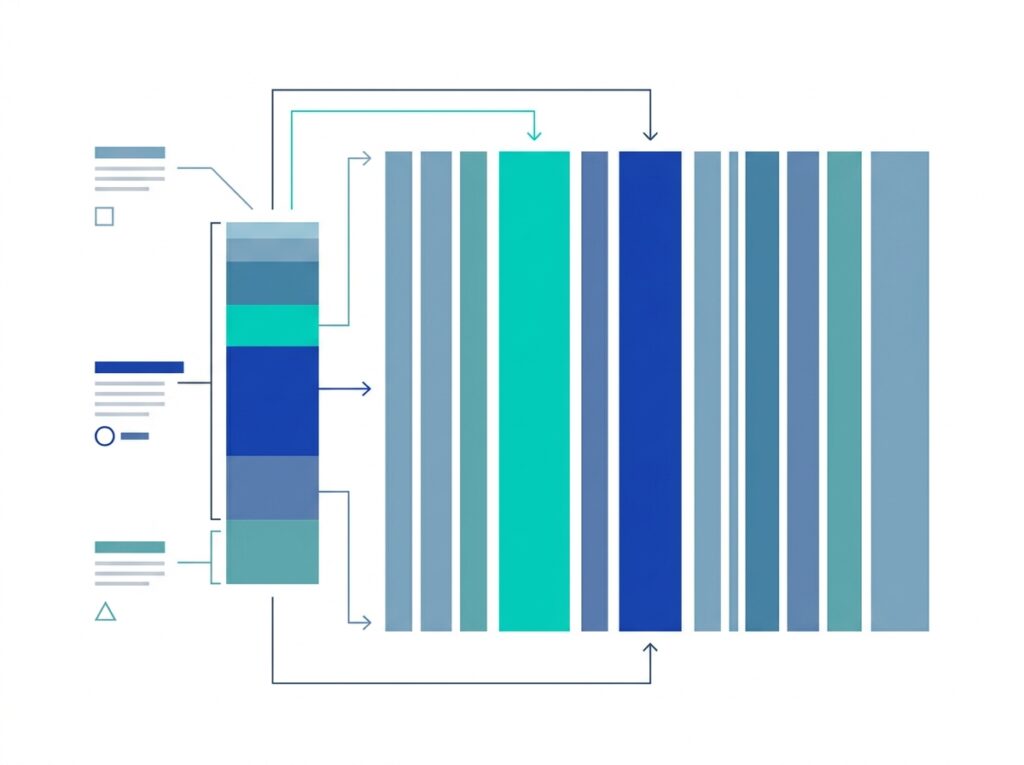
VertiPaq Analyzer, available through DAX Studio and documented by SQLBI, provides a detailed breakdown of your model’s storage: the size of each table and column, cardinality, and how much memory each consumes. This is the tool that answers the question “what is making my model so large?”
Armed with this breakdown, optimization becomes targeted. If a single high-cardinality column is consuming a large share of the model’s memory, you know precisely where to focus, whether by removing it, reducing its precision, or splitting it. VertiPaq Analyzer turns model optimization from a vague exercise into a data-driven one, showing you the largest, most impactful targets first.
Hospital Analytics Performance Example
This section applies the full optimization toolkit to a realistic, large-scale scenario: a hospital network’s equipment maintenance analytics, where a critical executive dashboard has become unacceptably slow. It demonstrates the complete workflow from problem to solution.
The Scenario
A hospital network’s biomedical analytics solution holds a substantial volume of data:
- 12 years of maintenance history
- 8 million maintenance records
- 250,000 work orders
- 40 hospitals
- 15 departments
- 3,000 medical devices
The problem: the executive equipment-reliability dashboard takes 35 seconds to load. Leadership has effectively stopped using it, and the analytics team is asked to fix it.
The Optimization Steps
The team works through a structured optimization pass, using the diagnostic tools to guide each decision:
- Remove unused columns. VertiPaq Analyzer reveals several large, unused columns, including a free-text notes field, that are removed from the model.
- Convert snowflake to star schema. The model’s chained dimension tables are flattened into a clean star schema, letting filters propagate efficiently.
- Reduce high-cardinality columns. A datetime column with second precision is split into separate date and time columns, sharply reducing cardinality and improving compression.
- Replace calculated columns with measures. Several heavy calculated columns are rewritten as measures, shrinking the model and improving flexibility.
- Enable Incremental Refresh. The maintenance fact table is configured to keep 12 years of history but refresh only recent data, easing refresh load and keeping the model lean.
- Simplify DAX. DAX Studio identifies two expensive measures, which are rewritten with variables and simpler logic to reduce storage-engine and formula-engine time.
- Reduce visuals from 28 to 12. The cluttered dashboard is redesigned around the metrics executives actually use, cutting the number of queries fired on load.
- Verify query folding. The Power Query steps are checked to confirm folding is preserved, so the source database does the filtering rather than Power BI.
- Use Performance Analyzer to confirm. Performance Analyzer identifies the remaining slow visuals and verifies that each optimization has taken effect.
The Result
After the optimization pass, the executive dashboard loads in under 5 seconds, down from 35. Nothing about the data or the insights changed; the solution simply stopped doing unnecessary work. Leadership returns to using the dashboard, and the analytics it provides once again informs decisions. This is the practical reality of performance optimization, the same information, delivered fast enough to actually be used.
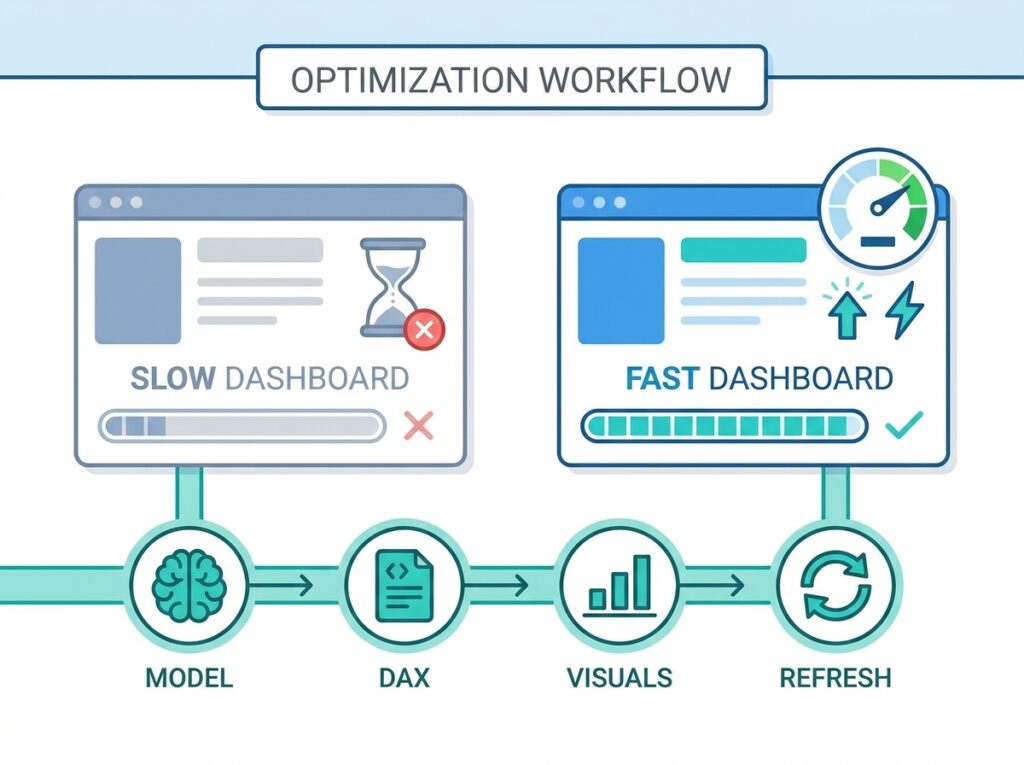
The workflow this example follows, diagnose with the tools, fix the model first, then DAX, then visuals, then refresh, and verify, is the repeatable pattern behind almost every successful Power BI optimization effort.
Power BI Performance Best Practices
Start with a clean star schema. The model structure is the foundation of performance. Get it right before optimizing anything else.
Load only what you need. Remove unused columns and rows, and store data at the grain your reports actually require.
Reduce cardinality wherever possible. Split high-precision columns and avoid unnecessary unique values to help VertiPaq compress efficiently.
Prefer measures over calculated columns. Keep the model lean and calculations dynamic by using measures for analytical logic.
Preserve query folding. Keep Power Query transformations foldable so the source database does the heavy lifting.
Limit visuals per page. Fewer, focused visuals load faster and communicate better. Aim for clarity over density.
Use Incremental Refresh for large tables. Refresh only recent data to keep refresh fast and the model manageable.
Measure before and after every change. Use Performance Analyzer, DAX Studio, and VertiPaq Analyzer to confirm each optimization genuinely helps, rather than assuming.
Common Performance Mistakes
Optimizing without measuring. Guessing at causes wastes effort and often changes the wrong things. Always diagnose with Performance Analyzer and the other tools first.
Loading a giant flat table. A single wide table forces VertiPaq to work inefficiently. Split it into a star schema of facts and dimensions.
Ignoring cardinality. High-cardinality columns silently bloat the model. Overlooking them is one of the most common causes of an unexpectedly large, slow dataset.
Overusing calculated columns. Building analytical logic as calculated columns instead of measures inflates the model and slows it. Reserve calculated columns for genuine row-level needs.
Cramming too many visuals onto a page. Each visual is a query. Twenty-plus visuals per page is a frequent, easily fixed cause of slow load times.
Breaking query folding unknowingly. A single non-foldable step can force Power BI to process everything locally. Check that folding is preserved, especially on large sources.
Full-refreshing very large tables. Reloading all history every time when Incremental Refresh would suffice wastes time and resources. Apply Incremental Refresh once tables grow large.
Conclusion
Power BI performance optimization is what allows a solution to remain fast, responsive, and trusted as data and usage grow. The causes of slowness, a poor model, high cardinality, inefficient DAX, too many visuals, broken folding, full refreshes, are well understood and entirely fixable, and the tools to diagnose them, Performance Analyzer, DAX Studio, and VertiPaq Analyzer, turn optimization from guesswork into a precise, evidence-based discipline.
The reliable workflow is consistent: measure first, fix the model, then the DAX, then the visuals, then the refresh, and verify each change. The hospital example shows this taking a dashboard from thirty-five seconds to under five, without changing a single insight, simply by removing wasted work. That is the essence of optimization.
Start with your slowest report. Run Performance Analyzer to find the bottleneck, check the model with VertiPaq Analyzer, and work through the techniques in this guide in order. The improvement is often dramatic, and it is what turns a technically correct Power BI solution into one people genuinely rely on every day.
Frequently Asked Questions
Most slow Power BI reports are caused by a poor data model (flat or snowflake structures, unused columns, high cardinality), inefficient DAX, or too many visuals on a page, rather than data volume alone. Broken query folding and full refreshes of large tables are also common causes. Use Performance Analyzer to pinpoint the specific bottleneck.
Speed up Power BI by building a clean star schema, removing unused columns, reducing column cardinality, preferring measures over calculated columns, limiting visuals per page, preserving query folding, and using Incremental Refresh for large tables. Diagnose bottlenecks first with Performance Analyzer, then apply the fix that addresses the specific slow visual or measure.
Generally yes. Import mode loads data into Power BI’s in-memory VertiPaq engine, delivering very fast query performance. DirectQuery queries the source live on each interaction, so its speed depends entirely on the source system and usually cannot match Import mode. Prefer Import for performance unless you need real-time data or the dataset is too large to import.
VertiPaq is the in-memory, columnar storage engine that powers Power BI’s Import mode. It compresses data column by column and holds it in memory for extremely fast querying. Most model-level performance techniques, such as reducing cardinality and removing unused columns, work by helping VertiPaq compress better and scan less data.
Performance Analyzer is a built-in Power BI Desktop tool, on the View ribbon, that records how long each visual takes to render and breaks the time into components such as the DAX query and visual display. It lets you identify exactly which visual is slow and why, so optimization targets the real bottleneck rather than guessing.
For most analytical logic, prefer measures. Calculated columns are computed row by row and stored in the model, consuming memory and increasing size, while measures are computed on demand and stored only as formulas. Measures are leaner, faster for large models, and dynamic. Reserve calculated columns for genuine row-level needs like categorizing or labelling rows.
There is no hard limit, but fewer is faster. Each visual issues its own query, so a page with twenty-plus visuals fires that many queries on load and slows dramatically. Aiming for roughly six to eight focused visuals per page improves both performance and clarity, and is a common, high-impact optimization for slow reports.
Yes, for large tables. Incremental Refresh partitions a table by date and refreshes only the recent portion instead of reloading all history, which sharply reduces refresh time and load on the source system. It also keeps the model manageable, indirectly supporting query performance. It is a key technique for datasets in the millions of rows.
DAX Studio is a free external tool that connects to a Power BI model to analyze query performance in detail. It captures the queries visuals generate, runs them in isolation, and shows server timings, including storage-engine versus formula-engine time. This reveals whether a slow measure is limited by data scanning or calculation logic, enabling precise, evidence-based DAX optimization.
2 thoughts on “Power BI Performance Optimization: The Complete Guide to Faster Reports”