
There is a moment every Power BI user eventually reaches. The basic reports are working. The data is connected, the visuals look clean, and the dashboard refreshes automatically. Then a stakeholder asks: “Can you show me sales growth compared to the same period last year?” or “What percentage of total revenue does each product line represent?”
At that point, dragging fields into visuals is no longer enough. That is where DAX begins.
DAX “Data Analysis Expressions” is the formula language that powers the analytical depth of Power BI. It is what separates a static summary from a genuinely intelligent business report. If you have been using Power BI for a while and feel like you are only scratching the surface of what it can do, learning DAX is the single most valuable investment you can make.
This guide covers DAX from first principles. No prior programming experience is needed. If you are comfortable with Excel formulas, you are already closer to understanding DAX than you might think.
New to Power BI entirely? Start with our What Is Power BI? Complete Beginner Guide for Business Reporting before continuing here.
What Is DAX?
DAX, which stands for Data Analysis Expressions, is a collection of functions, operators, and constants used to build formulas and expressions in Power BI, Power Pivot for Excel, and Analysis Services. It was designed specifically for working with relational data models and performing dynamic calculations that respond to how a user is filtering or viewing a report.
In practical terms, DAX is how you tell Power BI to calculate something — not just display raw data, but compute a result based on logic, context, and business rules.
When a Power BI report shows you “Year-to-Date Revenue,” “Customer Retention Rate,” or “Sales as a Percentage of Target,” DAX is working behind the scenes to produce those numbers. None of those calculations exist in the raw data. They are defined by DAX formulas written into the data model.
How Is DAX Different from Excel Formulas?
This is one of the most common questions from business analysts making the transition from Excel to Power BI. The surface-level syntax feels familiar DAX uses functions like SUM, AVERAGE, IF, and COUNT, just as Excel does. But the underlying logic operates differently in ways that matter.
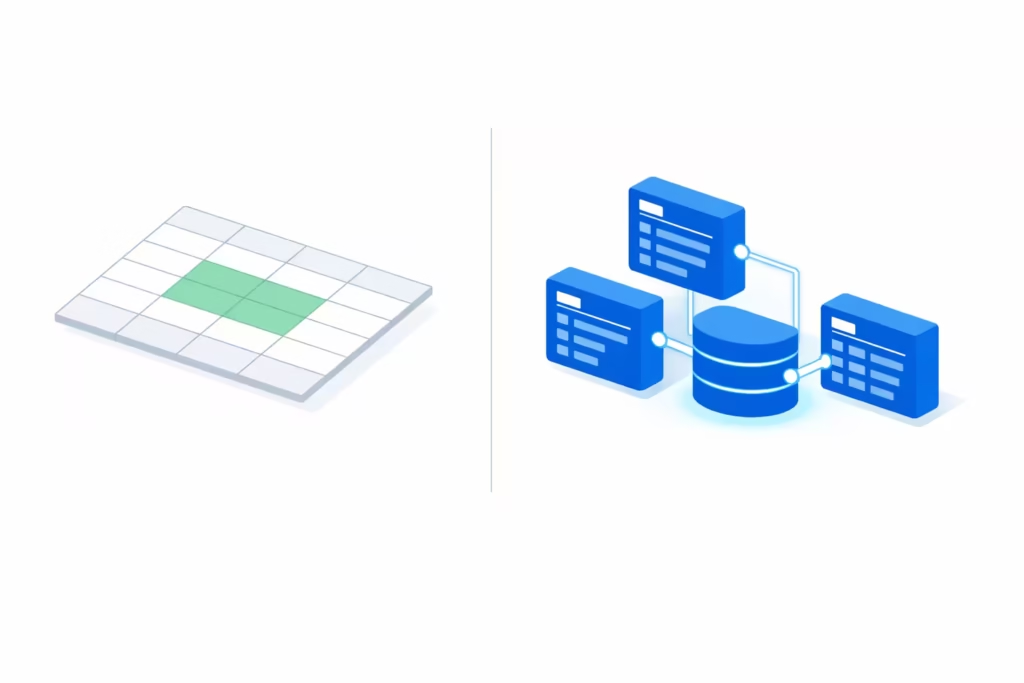
Excel formulas work on cells. DAX works on tables and columns.
In Excel, a formula like adds the values in a specific range of cells. If the data grows to row 51, your formula does not automatically include that new row unless you update the range. DAX, by contrast, operates on entire table columns. sums every value in the Amount column of the Sales table including any rows added in the next data refresh.
Excel formulas are static in position. DAX is dynamic in context.
This is the most important conceptual difference. A DAX measure does not produce a single fixed result. It produces a result that changes based on the filters and selections applied to the report. The same DAX measure that shows total company revenue on a summary page will automatically show only the selected region’s revenue when a user clicks on a region slicer. That responsiveness is built into how DAX evaluates you do not write separate formulas for different views.
Excel formulas live in cells. DAX formulas live in the data model.
DAX measures and calculated columns are stored inside the data model, not on a report canvas. This means the same calculation is available across every report page, every visual, and every view of the data consistently, without duplication.
| Feature | Excel Formulas | DAX Formulas |
|---|---|---|
| Operates on | Cell ranges | Table columns |
| Responds to filters | No | Yes — dynamically |
| Stored in | Worksheet cells | Data model |
| Recalculates with data growth | Only if range is updated | Automatically |
| Context-aware | No | Yes |
| Used for large datasets | Impractical at scale | Designed for scale |
The Two Things DAX Creates: Measures vs Calculated Columns
Before writing a single DAX formula, you need to understand the two output types DAX produces. Confusing them is the most common beginner mistake and it leads to slow reports and incorrect results.
What Is a DAX Measure?
A measure is a DAX formula that calculates a result dynamically at the moment a visual renders on screen. Measures are evaluated in real time based on the current filter context whatever slicers, filters, and visual interactions are active at that moment.
Measures are stored as formulas only. They do not add rows or columns to your data table. They use no additional storage until a visual requests a result.
A simple measure looks like this:
Total Sales = SUM(Sales[Amount])When this measure is placed in a bar chart broken down by month, it automatically calculates the total for each month. When a user filters by region, it recalculates for the selected region. The formula is written once and responds to every context automatically.
What Is a Calculated Column?
A calculated column is a DAX formula evaluated row by row when the dataset refreshes. It adds a new column to an existing table, where each row’s value is computed by the formula applied to that specific row.
A calculated column looks like this:
Profit Margin = Sales[Revenue] - Sales[Cost]This adds a “Profit Margin” column to the Sales table. Each row calculates the difference between that row’s Revenue and Cost values. The result is stored in the data model and occupies memory.
Measures vs Calculated Columns: When to Use Each
| Scenario | Use a Measure | Use a Calculated Column |
|---|---|---|
| Aggregating values (sum, average, count) | Yes | No |
| Creating a ratio or percentage | Yes | No |
| Year-over-year or time comparisons | Yes | No |
| Categorising rows (e.g. “High / Medium / Low”) | No | Yes |
| Combining text fields (full name from first + last) | No | Yes |
| Filtering rows based on a condition | No | Yes (or use a calculated table) |
| Anything that needs to respond to report filters | Yes | No |
The general guidance is: if in doubt, write a measure. Measures are more flexible, more efficient, and better aligned with how Power BI evaluates data at report time.
Understanding Context: The Core Concept Behind DAX
DAX has one concept that, once understood, makes everything else click. That concept is context.
Every DAX formula evaluates within a context the set of conditions that determines which rows of data are included in the calculation at any given moment. There are two types of context every DAX beginner must understand.
Filter Context
Filter context is the collection of filters active when a measure is evaluated. These filters come from slicers on the report, visual-level filters, page-level filters, and cross-filtering from other visuals a user has clicked.
When a user selects “Q3 2024” from a date slicer, the filter context for every measure on the page is updated to include only rows where the date falls within Q3 2024. Your measure returns Q3 revenue not because you wrote a different formula, but because the filter context changed.
This is why the same measure can produce different results in different parts of the report simultaneously. A matrix showing sales by region and month is evaluating dozens of times once for each cell each time with a different filter context applied.
Row Context
Row context applies when DAX evaluates a calculated column. As the formula processes each row in a table, it knows which specific row it is operating on. That is the row context.
When you write , DAX uses the row context to know that it should subtract this row’s Cost from this row’s Revenue not an average, not a total, but the specific values on each individual row.
Understanding the difference between these two contexts and knowing which one is active in a given formula is the foundation of writing DAX that behaves as intended. Most DAX errors that beginners encounter come from misunderstanding which context is in play.
The Most Important DAX Functions for Beginners
You do not need to learn every DAX function before becoming productive. The following functions cover the vast majority of real business reporting requirements and form the practical core of any Power BI data model.
Aggregation Functions
These are the most intuitive starting point, particularly for Excel users.
Total Revenue = SUM(Sales[Revenue])
Average Order Value = AVERAGE(Sales[OrderAmount])
Transaction Count = COUNT(Sales[OrderID])
Unique Customers = DISTINCTCOUNT(Sales[CustomerID])
Largest Order = MAX(Sales[OrderAmount])
Each of these responds to filter context automatically. Place them in a visual filtered by date, region, or product and they recalculate without any modification to the formula.
CALCULATE: The Most Powerful DAX Function
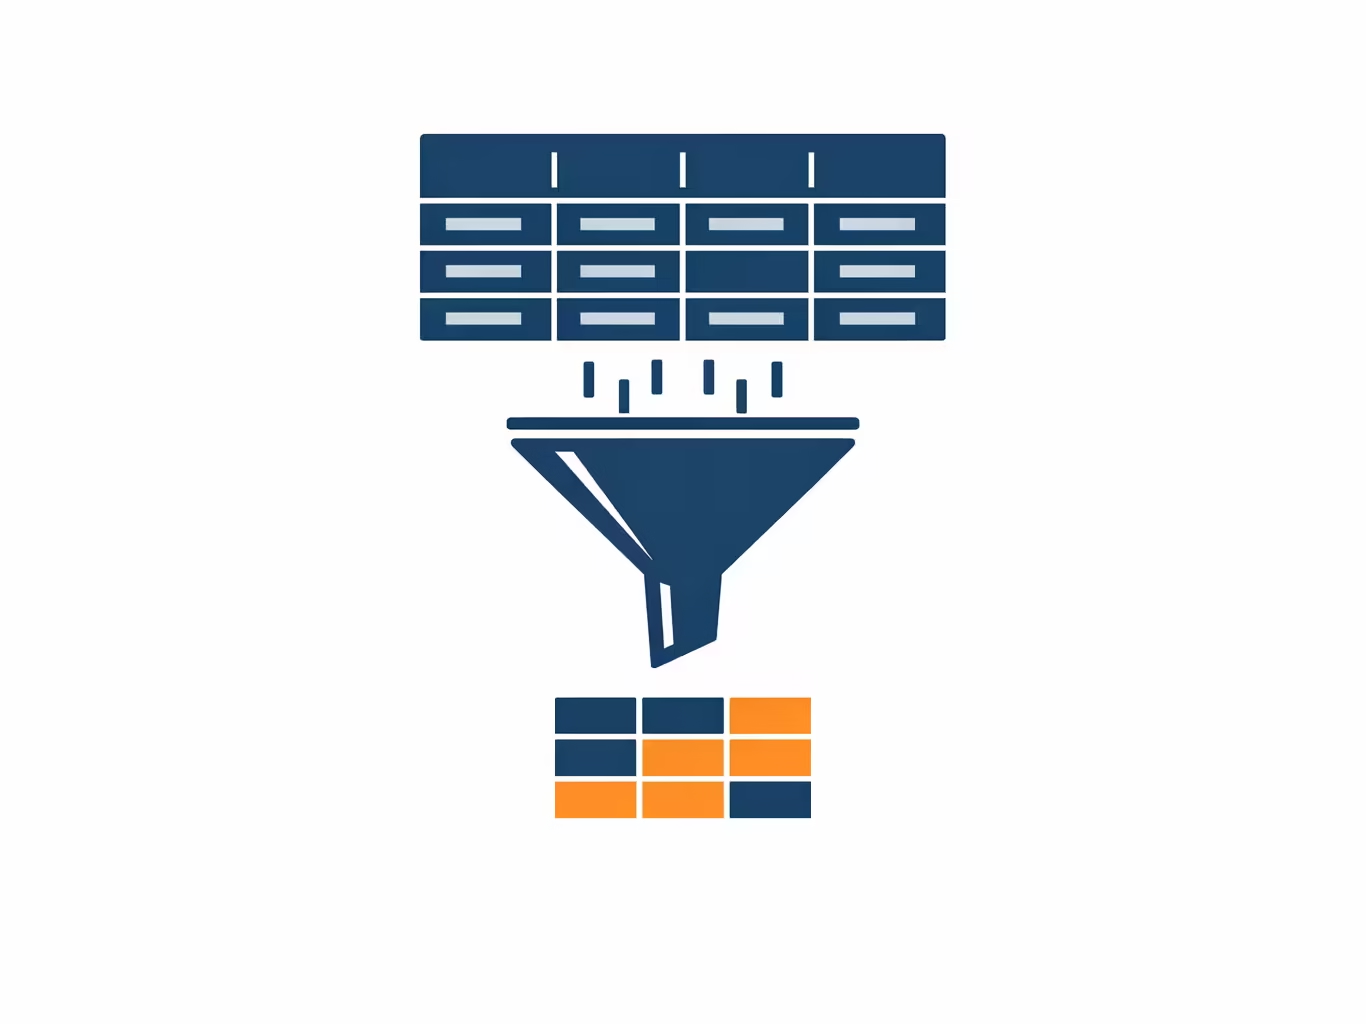
is the function that gives DAX its real analytical power. It evaluates a measure or expression while modifying the filter context. In plain terms: it lets you change the conditions under which a calculation runs.
UK Sales = CALCULATE([Total Revenue], Sales[Region] = "UK")This calculates Total Revenue, but only for rows where Region equals “UK” regardless of what other filters are active on the report. CALCULATE overrides or adds to the existing filter context for the duration of the expression.
All Products Revenue = CALCULATE([Total Revenue], ALL(Products))Here, removes any product-level filters from the context, allowing the measure to return total revenue across all products even when a specific product is selected. This is how percentage-of-total calculations are built.
IF and SWITCH: Conditional Logic
Performance Band =
IF(
    [Total Revenue] >= 100000,
    "High",
    IF(
        [Total Revenue] >= 50000,
        "Medium",
        "Low"
    )
)offers a cleaner syntax when there are multiple conditions:
Quarter Label =
SWITCH(
    QUARTER(Sales[OrderDate]),
    1, "Q1",
    2, "Q2",
    3, "Q3",
    4, "Q4",
    "Unknown"
)
DIVIDE: Safe Division
Never use the forward slash operator for division in DAX measures. Use DIVIDE instead. It handles division-by-zero errors cleanly without crashing your report.
Profit Margin % = DIVIDE([Total Profit], [Total Revenue], 0)The third argument is the value returned when the denominator is zero. Using 0 here prevents blank or error values from appearing in visuals.
Time Intelligence Functions
Time intelligence is where DAX creates capabilities that simply do not exist in spreadsheet-based reporting. These functions require a properly structured Date table in your data model to work correctly.
YTD Revenue = TOTALYTD([Total Revenue], 'Date'[Date])

Revenue Last Year = CALCULATE([Total Revenue], SAMEPERIODLASTYEAR('Date'[Date]))

YoY Growth =
DIVIDE(
    [Total Revenue] - [Revenue Last Year],
    [Revenue Last Year],
    0
)
These three measures together give any business dashboard the core time comparison capabilities that senior stakeholders almost always request. They are also a clear illustration of why DAX is worth learning — building equivalent logic in Excel requires significantly more manual effort and produces results that do not respond dynamically to date filters.
Iterator Functions (X Functions)
Iterator functions evaluate an expression row by row across a table, then aggregate the results. They are powerful when you need to calculate something at the row level before summing or averaging.
Total Revenue Calculated = SUMX(Sales, Sales[Quantity] * Sales[UnitPrice])This multiplies Quantity by Unit Price for each row, then sums all those row-level results. If your data table does not already contain a Revenue column, this approach calculates it dynamically without creating a calculated column.
A Practical DAX Example: Building a Sales Performance Model
To see how these functions work together in practice, consider a straightforward sales reporting scenario. A retail business wants a Power BI dashboard showing current revenue, year-to-date performance, growth versus last year, and margin percentage.
The data model includes a Sales table (OrderID, Date, Product, Region, Quantity, UnitPrice, Cost) and a Date table.
The core measures required are:
-- Base measures
Total Revenue = SUMX(Sales, Sales[Quantity] * Sales[UnitPrice])
Total Cost = SUMX(Sales, Sales[Quantity] * Sales[Cost])
Total Profit = [Total Revenue] - [Total Cost]

-- Profitability
Gross Margin % = DIVIDE([Total Profit], [Total Revenue], 0)

-- Time intelligence
YTD Revenue = TOTALYTD([Total Revenue], 'Date'[Date])
Revenue PY = CALCULATE([Total Revenue], SAMEPERIODLASTYEAR('Date'[Date]))
Revenue Growth % = DIVIDE([Total Revenue] - [Revenue PY], [Revenue PY], 0)

-- Context override
Revenue % of Total =
DIVIDE(
    [Total Revenue],
    CALCULATE([Total Revenue], ALL(Sales)),
    0
)
With these eight measures, the entire dashboard is driven by clean, reusable logic. Each measure responds to any combination of filters a user applies. The analyst builds the measures once; the report handles every possible combination of date, region, and product automatically.
DAX Best Practices for Beginners
Knowing the functions is one thing. Writing DAX that performs well and remains maintainable over time requires a set of practices that experienced Power BI developers follow consistently.
Use measures over calculated columns wherever possible: Calculated columns are stored in memory row by row and increase the dataset size. Measures are computed on demand and are far more efficient for most analytical scenarios.
Always format your DAX formulas for readability: DAX Studio and Power BI Desktop’s formula bar both support multi-line DAX. A measure written across multiple lines with indentation is significantly easier to understand, debug, and maintain.
Name your measures clearly and consistently: A measure named is unambiguous. A measure named Rev_Final_V3 is not. Use a naming convention and stick to it across the entire data model.
Build a proper Date table: Time intelligence functions require a contiguous Date table with no gaps, covering the full range of dates in your data. Never rely on Power BI’s auto-generated date hierarchies for serious time intelligence work. Build or import a dedicated Date table.
Use DIVIDE instead of the division operator: This single habit eliminates an entire class of report errors caused by division by zero.
Test measures in a simple table visual first: Before placing a measure in a complex visual, test it in a basic table with the relevant columns. This isolates whether unexpected results are caused by the DAX formula or by the visual configuration.
Avoid nested IF statements beyond two levels: Deep nesting becomes unreadable quickly. Use SWITCH for multi-condition logic and consider helper measures or calculated columns for particularly complex logic chains.
Common Beginner Mistakes in DAX
Writing calculated columns when measures are needed: This is the most frequent mistake, and it creates reports that are inflexible, slow, and difficult to maintain. If the calculation needs to change based on report filters, it must be a measure.
Forgetting that time intelligence requires a Date table: TOTALYTD, SAMEPERIODLASTYEAR, and similar functions silently return incorrect results when the Date table is improperly configured. Every Power BI model with time-based analysis needs a dedicated, properly marked Date table.
Using SUM when SUMX is needed: SUM aggregates an existing column. SUMX evaluates an expression row by row before aggregating. If your base data does not contain a pre-calculated revenue column, returns blank or zero. returns the correct result.
Not understanding filter context in CALCULATE: The most common advanced error is using CALCULATE without fully understanding how it modifies the filter context. Testing measures with a filter slicer turned on and off is a reliable way to verify that CALCULATE is behaving as intended.
Copying DAX from the internet without understanding it: DAX code is widely shared online, and using examples is a legitimate learning approach. However, pasting formulas into a model without understanding the logic leads to errors that are very difficult to diagnose later.
Is DAX Difficult to Learn?
DAX has a reputation for being challenging, and that reputation is partly deserved. The syntax itself is approachable, especially for Excel users. The challenge lies in the conceptual shift required to understand how filter context and row context work, and how CALCULATE manipulates them.
Most Power BI beginners can write functional basic measures within a few days of structured practice. Reaching genuine proficiency with CALCULATE and time intelligence typically takes two to three months of consistent hands-on work.
The practical threshold the point where DAX knowledge is sufficient to build any standard business intelligence report is achievable within a few weeks of focused learning using the free resources available through Microsoft Learn and the Power BI community.
Getting Started With DAX: A Practical First Sequence
If you are building your first DAX knowledge, this sequence produces the fastest meaningful progress.
- Ensure you have a working Power BI data model with at least one fact table and one dimension table connected by a relationship.
- Create your first measure using SUM on a numeric column and add it to a card visual.
- Add a slicer and observe how the measure value changes as you filter this demonstrates filter context in action.
- Write a DIVIDE measure to calculate a percentage and format it as a percentage value.
- Build a Date table and create a TOTALYTD measure. Place it alongside your base measure in a line chart broken down by month.
- Write a CALCULATE measure that filters by a single dimension value (such as a specific category or region).
- Study the DAX function reference in Microsoft’s official documentation for any function you do not yet understand.
Once you are comfortable with DAX fundamentals, the next logical step is applying them in well-designed dashboards. Our [Power BI Dashboard Best Practices Guide] covers how to structure and design reports that communicate clearly — coming next in the Zytriona series.
Conclusion: Why DAX Is Worth the Investment
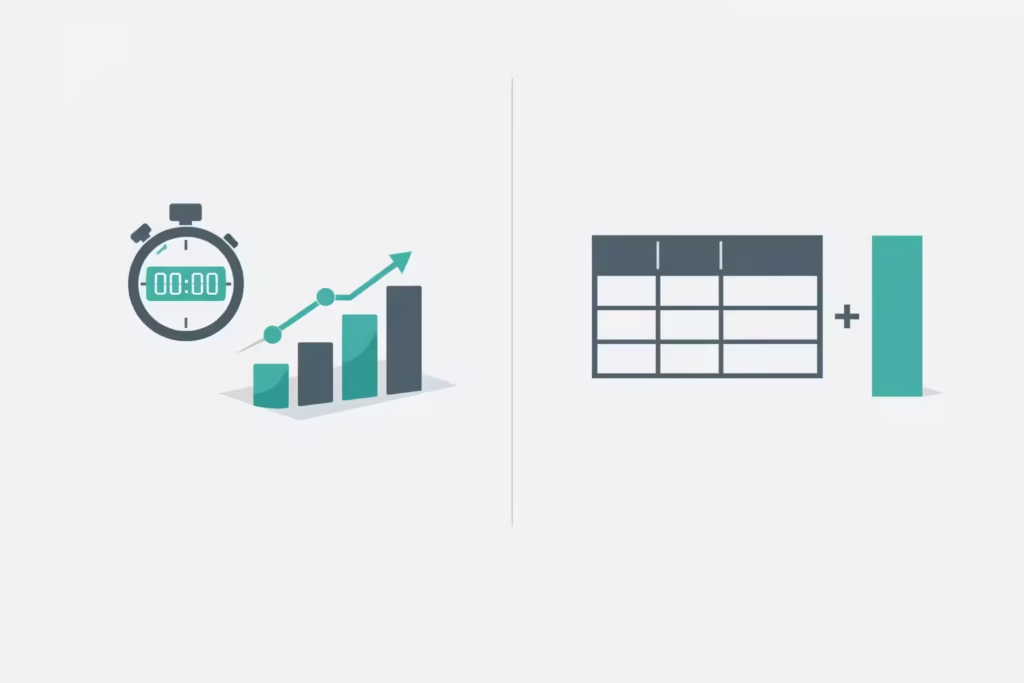
DAX is the difference between a Power BI report that summarises data and one that genuinely analyses it. Learning DAX means you can build the year-over-year comparisons, the percentage breakdowns, the conditional classifications, and the dynamic benchmarks that transform a dashboard from a data display into a decision-making tool.
The learning investment is real, but so is the return. Analysts who understand DAX can answer business questions directly in Power BI that would otherwise require hours of Excel work. That capability — the ability to respond to new analytical questions quickly and reliably — is what makes a Power BI developer genuinely valuable to a business.
Start with SUM, DIVIDE, and IF. Understand filter context. Write ten measures. From there, the progression toward CALCULATE and time intelligence follows naturally.
From our series: What Is Power BI? — Power BI vs Excel — Dashboard Best Practices] — [Power Automate for Reporting] — [Power BI for Healthcare Analytics]
FAQ SECTION:
DAX stands for Data Analysis Expressions. It is the formula language used in Power BI, Power Pivot for Excel, and Analysis Services to create calculated measures, calculated columns, and calculated tables within a data model.
DAX and Excel formulas share some function names such as SUM, AVERAGE, and IF but they operate differently. Excel formulas work on cell ranges and produce static results. DAX formulas work on entire table columns and respond dynamically to the filters and selections applied to a Power BI report.
What is the difference between a measure and a calculated column in DAX?
A measure is a DAX formula that calculates a result dynamically at the time a visual renders, based on the current filter context. A calculated column is a DAX formula evaluated row by row when data refreshes, adding a new column to a table. Measures are preferred for aggregations and analysis; calculated columns are used to classify or label rows.
Filter context is the set of filters applied to a calculation when it is evaluated. It comes from slicers, visual-level filters, and cross-filter interactions on a Power BI report. When a user selects a date range or clicks a region on a map, the filter context changes and every DAX measure on the report recalculates automatically based on that new context.
CALCULATE is a DAX function that evaluates an expression while modifying the current filter context. It is the most powerful and widely used function in DAX. It allows analysts to override, add to, or remove filters from a calculation enabling logic such as “total sales for a specific region regardless of what the user has selected” or “revenue compared to the same period last year.”
Beginners should start with SUM, AVERAGE, COUNT, DISTINCTCOUNT, and DIVIDE for basic aggregation and safe division. From there, IF and SWITCH cover conditional logic. CALCULATE is the most important advanced function and should be introduced once the concept of filter context is understood. Time intelligence functions such as TOTALYTD and SAMEPERIODLASTYEAR follow once a Date table is in place.
DAX syntax is approachable, particularly for analysts with Excel experience. The main conceptual challenge is understanding how filter context and row context work concepts that have no direct equivalent in spreadsheet formulas. Most beginners can write functional DAX measures within a few days of structured practice. Proficiency with advanced functions typically develops over two to three months of consistent hands-on work.
Basic Power BI reports can be built without writing any DAX, using built-in aggregations and the drag-and-drop interface. However, DAX becomes necessary as soon as reports require calculations beyond simple totals such as year-over-year comparisons, percentage of total, conditional classifications, or any metric that is not present as a pre-calculated column in the raw data.