
You have built a report in Power BI Desktop. The data model is clean, the measures calculate correctly, and the dashboard looks professional. Now comes the question that every Power BI project eventually reaches: how do the people who need this report actually get to see it? Emailing a .pbix file to twenty colleagues creates twenty disconnected copies that do not refresh, and it prevents administrators from controlling who can access specific content
This is the problem the Power BI Service solves. The Power BI Service is the cloud platform where organizations publish, share, secure, and schedule report refreshes, enabling users to access the reports they need. If Power BI Desktop is where developers build reports, the Power BI Service is where users access and use them. Understanding it is the step that turns a report on your laptop into a reporting solution for your organization.
This guide explains the Power BI Service from the ground up: how it differs from Desktop, how publishing and workspaces work, the difference between reports, dashboards, and apps, how sharing and permissions function, how scheduled refresh and the data gateway keep data current, and how licensing actually works. It includes a complete hospital reporting workflow showing the Service in a real multi-department environment.
This article is part of the Zytriona Power BI learning series, building on How to Build Your First Power BI Dashboard, Power Query in Power BI Explained, and Power BI Data Modeling Explained. If you are new to the platform, start with What Is Power BI?
What Is Power BI Service?
The Power BI Service is the cloud-based platform, accessed at app.powerbi.com, where Power BI reports and dashboards are published, shared, and consumed. It is the online, software-as-a-service component of Power BI, hosted and maintained by Microsoft, requiring no installation. For Microsoft’s official overview of Row-Level Security, see the official documentation. Microsoft’s Row-Level Security documentation

Where Power BI Desktop is a Windows application you install and use to author reports, the Power BI Service is a browser-based environment your whole organization can access. Developers publish a report to the Power BI Service after building it, allowing others to view, interact with, and rely on the most current version.
The Service handles everything that happens after authoring: storing published reports, organizing them into workspaces, distributing them through apps, controlling who can see and edit what, refreshing the underlying data on a schedule, and delivering reports to mobile devices. It is the collaboration and distribution layer of the entire Power BI platform.
For most organizations, the Power BI Service is where the majority of people spend all their time. By contrast, report authors work in Power BI Desktop, while everyone else ncluding managers, executives, and analysts who consume reports rather than build them primarily uses the Power BI Service.
Power BI Desktop vs Power BI Service
Understanding the division of labor between Desktop and Service is fundamental. They are two halves of one platform, each designed for a different part of the workflow.
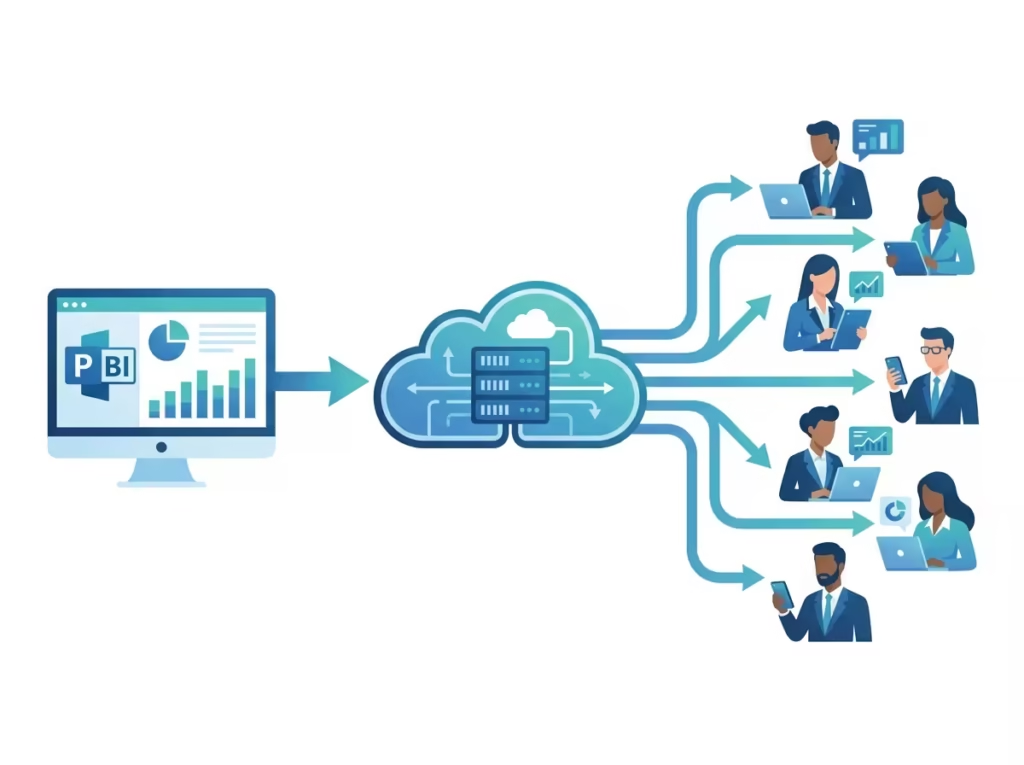
Power BI Desktop is the authoring environment. It is where you connect to data, shape it in Power Query, build the data model, write DAX measures, and design report visuals. It is free, installed on Windows, and used by report creators.
The Power BI Service is the publishing, sharing, and consumption environment. It is where published reports are stored, organized, secured, refreshed, and distributed. It runs in the browser and on mobile, and it is used by both creators (to manage and share) and consumers (to view and interact).
| Feature | Power BI Desktop | Power BI Service |
|---|---|---|
| Report creation | Yes, full authoring | Limited editing only |
| Data modeling and DAX | Yes | Not for authoring |
| Power Query transformations | Yes | Limited (dataflows) |
| Dashboard creation | No | Yes |
| Sharing and distribution | No | Yes |
| Cloud hosting | No | Yes |
| Collaboration | No | Yes |
| Scheduled refresh | No | Yes |
| Mobile access | No | Yes |
| Cost | Free | Free tier plus paid licenses |
The practical workflow is a one-way flow for authoring: build in Desktop, publish to the Service, manage and share in the Service. While the Service does allow limited web-based report editing, serious authoring, data modeling, complex DAX, and Power Query work happen in Desktop. Dashboards, however, can only be created in the Service, because they are assembled from tiles pinned out of published reports, a distinction covered in detail in How to Build Your First Power BI Dashboard.
How Power BI Service Works
The Power BI Service operates on a cloud architecture in which Microsoft’s Azure infrastructure hosts published reports and their underlying datasets, delivering them to users through web browsers and mobile applications.

The core flow works like this. A report author finishes a report in Power BI Desktop and clicks Publish. The report file, including its data model and any imported data, uploads to a workspace in the Service. Once published, the Power BI Service allows administrators to configure scheduled dataset refreshes, pin reports to dashboards, and share or distribute the entire package to other users.
Behind the scenes, the Service separates two things that Desktop keeps together: the dataset (the data model and its data) and the report (the visuals built on that dataset). This separation is powerful. Multiple reports can be built on a single shared, centrally refreshed dataset, ensuring everyone works from the same governed data rather than duplicating it.
When a user opens a report in the Service, the visuals query the hosted dataset in real time, applying that user’s permissions and any row-level security rules. The result is that the right people see the right data, always current to the last scheduled refresh, without anyone managing file versions or manual updates.
Understanding Workspaces
A workspace is a container in the Power BI Service where related reports, dashboards, datasets, and dataflows are stored, developed, and managed by a team. Workspaces are the organizational backbone of the Service.

Think of a workspace as a shared project folder with built-in collaboration and permission controls. A finance team has a finance workspace containing their reports and datasets. A hospital’s radiology department has a radiology workspace. Members of a workspace can collaborate on its content, with their level of access controlled by the role they are assigned.
The Power BI Service provides four workspace roles, each granting a different level of access:
- Admin: full control, including managing access and deleting the Workspace.
- Member: can publish, edit, and share content within the Workspace.
- Contributor: can create and edit content but cannot manage access or publish apps.
- Viewer: can only view the content, not edit it.
Every user starts with a personal workspace called “My Workspace,” intended for individual, private content. Real collaboration happens in shared workspaces, which are the foundation for team development and, ultimately, for distributing content through apps.
Reports vs Dashboards
This distinction confuses many beginners, and understanding it is essential to using the Service effectively. Reports and dashboards are different objects with different purposes.
A report is a multi-page, fully interactive document built in Power BI Desktop and published to the Service. Reports contain detailed visuals, slicers, filters, and drill-down capability across one or more pages. Users can explore data freely within a report.
A dashboard is a single-page canvas, created only in the Service, made up of tiles pinned from one or more reports. Dashboards provide an at-a-glance summary and can combine visuals from multiple different reports and datasets onto one screen, something a report cannot do.
| Aspect | Report | Dashboard |
|---|---|---|
| Where created | Power BI Desktop | Power BI Service only |
| Pages | Multiple | Single canvas |
| Data sources | One dataset per report | Tiles from multiple reports/datasets |
| Interactivity | Full, slicers, filters, drill-down | Limited, click-through to report |
| Purpose | Detailed analysis | At-a-glance monitoring |
The two work together. A team builds detailed reports in Desktop, publishes them, then pins the most important visuals from those reports into a dashboard for executives who need the headline at a glance. The detailed design principles for both are covered in 10 Power BI Dashboard Best Practices.
Power BI Apps Explained
A Power BI app is a packaged, read-only collection of dashboards and reports, published from a workspace and distributed to a broad audience of end users. Apps are how Power BI content is delivered at scale across an organization.
The distinction between a workspace and an app is the distinction between development and distribution. A workspace is where a team builds and collaborates on content; it is the working environment. An app is the polished, published output of that Workspace, delivered to consumers who only need to view the content, not edit it.
| Aspect | Workspace | App |
|---|---|---|
| Purpose | Development and collaboration | Distribution to end users |
| Audience | The team building content | The wider organization |
| Access | Edit (based on role) | Read-only |
| Scope | Internal team | Organization-wide |
Using apps rather than sharing individual reports has real advantages. Apps present a clean, curated experience, end users see only the finished content, organized with navigation, not the work-in-progress items in the Workspace. Updates are controlled: the team can revise content in the Workspace and publish the updated app when ready, rather than every edit immediately affecting all viewers. And apps scale to large audiences far more manageably than sharing items one at a time.
Sharing Reports Securely
The Power BI Service offers several methods for sharing content, and choosing the right one depends on the audience size and the security requirements.

Apps are the recommended method for distributing content to a wide audience, as covered above. They provide a controlled, curated, read-only experience suited to organization-wide distribution.
Direct sharing allows you to share a specific report or dashboard with named individuals or groups. This is suited to smaller, targeted sharing, sending one report to a handful of specific colleagues.
Workspace access grants people a role within a workspace, appropriate for collaborators who are actively working on content rather than just consuming it.
Underlying all sharing is a critical security feature: row-level security (RLS). Row-level security restricts the data a user can see within a report based on their identity, so a single report can show each regional manager only their own region’s data, or each hospital department only its own equipment. This is essential in any environment with data governance requirements. According to Microsoft’s row-level security documentation, RLS is enforced in the Service, making it the layer where data access control is genuinely applied.
An important licensing point governs sharing: in most cases, both the person sharing and the person receiving need a Power BI Pro license, unless the content is hosted in Premium capacity. This is explained in the licensing section below.
Scheduled Refresh
Scheduled refresh is the Power BI Service feature that automatically updates a dataset’s data on a defined schedule, ensuring reports and dashboards reflect current information without manual intervention. It is one of the most valuable capabilities the Service provides.
When you publish a report with imported data, that data is a snapshot from the moment of publishing. Without refresh, it becomes progressively stale. Scheduled refresh solves this by reconnecting to the original data source on a schedule you define, up to eight times per day on a Pro license, and up to 48 times per day on Premium, pulling the latest data and updating everything built on that dataset automatically.
Configuring scheduled refresh involves specifying the frequency, the times of day, and the credentials the Service uses to connect to the source. For cloud data sources like Azure SQL Database or SharePoint Online, the Service connects directly. For data sources located on-premises, such as a SQL Server in the organization’s own data center, or files on an internal network, the Service needs a bridge to reach behind the corporate firewall. That bridge is the data gateway.
Power BI Gateway Explained
The Power BI data gateway is a piece of software installed on-premises that acts as a secure bridge, allowing the Power BI Service in the cloud to connect to data sources located inside an organization’s own network. It is the component that makes scheduled refresh possible for on-premises data.
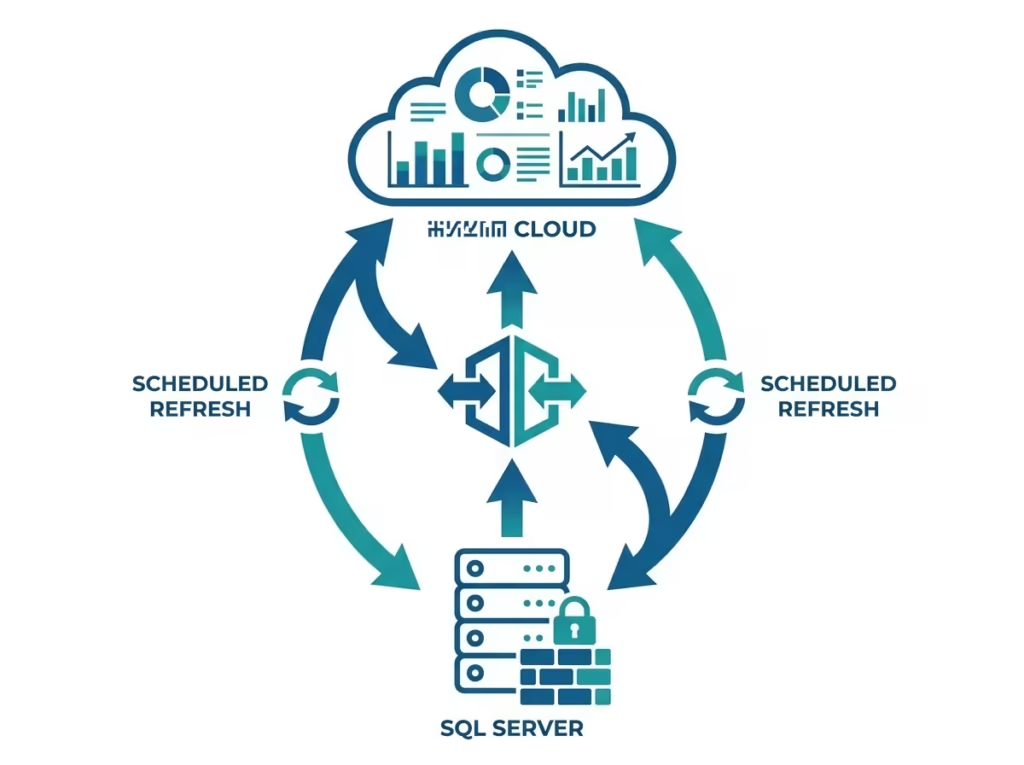
The need for a gateway arises from a simple architectural reality: the Power BI Service runs in Microsoft’s cloud, but much organizational data lives on internal servers behind a firewall. The Service cannot reach that data directly. The gateway, installed on a machine inside the network, receives refresh requests from the Service, securely retrieves the data from the internal source, and returns it to the Service, all without exposing the internal source directly to the internet.
There are two gateway types. The standard (enterprise) gateway is installed on a dedicated server and supports multiple users and data sources across an organization; it is the right choice for production deployments. The personal gateway is a simpler, single-user version suited to an individual analyst refreshing their own reports. Microsoft’s data gateway documentation provides the full setup and configuration details.
For any organization whose reports draw on on-premises databases, the gateway is not optional; it is the essential link that keeps published reports current.
Licensing Options
Power BI licensing determines who can publish, share, and consume content, and it is one of the areas beginners find most confusing. The structure breaks into a small number of tiers.
Power BI Free (Fabric free) The Free license allows an individual to use Power BI Desktop and publish content to their personal workspace in the Power BI Service. However, free users cannot share content with others; consequently, in most scenarios, they also cannot access content shared by other users. It is suited to individual, personal use.
Power BI Pro is the standard license for collaboration and sharing. It allows a user to publish to shared workspaces, share reports and dashboards, and consume content that others have shared. Pro is licensed per user per month and is included in Microsoft 365 E5 subscriptions. For most organizations, Pro is the practical baseline for anyone who creates or shares content.
Power BI Premium Per User (PPU): extends Pro with advanced capabilities, larger datasets, more frequent refreshes, and features like paginated reports and advanced AI, while remaining a per-user license.
Power BI Premium (capacity) / Microsoft Fabric capacity is a capacity-based license, purchased as dedicated cloud resources rather than per user. Its defining advantage is that content hosted in Premium capacity can be consumed by users who do not hold individual Pro licenses, making it cost-effective for distributing reports to very large audiences.
| Licence | Publish & Share | Consume Shared Content | Best For |
|---|---|---|---|
| Free | Own workspace only | No (limited) | Individual personal use |
| Pro | Yes | Yes | Teams collaborating and sharing |
| Premium Per User | Yes, plus advanced features | Yes | Power users needing advanced capability |
| Premium / Fabric Capacity | Yes | Yes, including Free users | Large-scale distribution |
Because licensing and pricing change over time, always confirm current details against Microsoft’s official Power BI pricing page before making purchasing decisions.
The Microsoft Fabric Relationship
Power BI is now part of Microsoft Fabric, Microsoft’s unified analytics platform. Fabric brings Power BI together with data engineering, data warehousing, and data science capabilities under a single umbrella. For most Power BI users, this relationship is background context rather than a day-to-day concern, the Power BI Service continues to work as described here. But it explains why the “free” tier is now sometimes labeled “Fabric free” and why capacity licensing increasingly references Fabric. As Fabric adoption grows, understanding that Power BI sits within it becomes progressively more relevant.
Deployment Workflow
Bringing the pieces together, the standard workflow for taking a report from creation to organization-wide consumption follows a clear sequence.
- Build the report in Power BI Desktop, data, model, measures, visuals.
- Publish the report from Desktop to a shared workspace in the Service.
- Configure the gateway if the report uses on-premises data sources.
- Set up scheduled refresh so the dataset stays current automatically.
- Apply row-level security if different users should see different data.
- Create dashboards by pinning key visuals from the published report.
- Publish an app from the Workspace to distribute the content to end users.
- Users consume the content through the browser and mobile apps, seeing only the data their permissions allow.
This sequence- build, publish, gateway, refresh, secure, dashboard, distribute, consume- is the backbone of virtually every Power BI deployment, from a small team to a large enterprise.
Hospital Reporting with Power BI Service
This section demonstrates the Power BI Service in a realistic, multi-department hospital environment. It shows how the concepts above- publishing, workspaces, scheduled refresh, department-specific dashboards, row-level security, and mobile access- come together in an operational setting where reporting governance genuinely matters.

The Scenario
A hospital needs reporting across several departments, each with distinct data and distinct audiences:
- Biomedical Engineering: medical equipment uptime, maintenance compliance, breakdown tracking.
- ICU: bed occupancy, patient acuity, staffing levels.
- Radiology: scan volumes, equipment utilization, appointment waiting times.
- Pharmacy: dispensing volumes, stock levels, controlled drug tracking.
- Administration: cross-department KPIs, financial summaries, executive overview.
Each department needs its own reporting, department heads need to manage their own area, and hospital executives need a consolidated view they can check from anywhere, including on their phones between meetings.
The Workflow in the Service
Step 1: Build in Desktop. Analysts build each department’s report in Power BI Desktop, applying the data modeling principles from Power BI Data Modeling Explained: clean star schemas, proper Date tables, and well-structured relationships.
Step 2: Organize into workspaces. Each department gets its own Workspace: a Biomedical Engineering workspace, an ICU workspace, a Radiology workspace, and so on. This keeps content organized and lets each department’s analysts collaborate within their own area. Department heads are assigned Member or Admin roles in their own Workspace; analysts are Contributors.
Step 3: Publish and configure refresh. Reports are published from Desktop to their department workspaces. Because much of the hospital’s data lives in on-premises systems, the CMMS for equipment, the patient administration system, and the pharmacy stock system, a standard data gateway is installed on a hospital server. Scheduled refresh is configured against this gateway, refreshing critical operational dashboards multiple times per day and slower-moving datasets overnight.
Step 4: Apply row-level security. Row-level security ensures each department head sees only their own department’s data within shared reports, while hospital executives see the full picture. A radiology manager opening the consolidated report sees radiology data; the chief operating officer sees everything.
Step 5: Build department dashboards. In each Workspace, key visuals are pinned into a department dashboard, the Biomedical Engineering dashboard leads with overdue maintenance count and equipment uptime, exactly as designed in How to Build Your First Power BI Dashboard.
Step 6: Distribute through apps. Each department publishes an app from its Workspace, delivering a clean, read-only experience to the staff who need to view the reports without editing them. A separate executive app consolidates the cross-department overview for hospital leadership.
Step 7: Executives access on mobile. Hospital executives access the executive app through the Power BI mobile app on their phones and tablets. The dashboards, designed with mobile layouts as covered in the dashboard best practices guide, present the critical hospital-wide KPIs at a glance, wherever the executive happens to be.

Why This Demonstrates the Service’s Value
This workflow shows the Power BI Service doing what Desktop alone never could: taking reports built by different analysts across different departments and turning them into a governed, secured, automatically refreshed, organization-wide reporting system accessible on any device. The gateway keeps on-premises hospital data flowing. Row-level security enforces appropriate access in a sensitive environment. Workspaces keep departments organized. Apps deliver clean experiences to staff. Mobile access reaches executives anywhere. This is the operational reality of the Service in an environment where getting reporting governance right is not optional.
Power BI Service Best Practices
Use shared workspaces, not My Workspace, for anything that matters. My Workspace is for personal, private content. Any report others depend on belongs in a shared workspace with appropriate roles assigned.
Distribute through apps rather than sharing items individually. Apps provide a cleaner, more controlled, more scalable experience than sharing individual reports and dashboards one by one.
Assign the minimum necessary workspace role. Give people Viewer or Contributor access unless they genuinely need Member or Admin. This follows the security principle of least privilege.
Use a standard data gateway for production, not the personal gateway. The standard gateway supports multiple users and sources and is the appropriate choice for any shared production deployment.
Set refresh frequency to match the data, not the maximum. Refresh operational dashboards frequently, but do not schedule unnecessary refreshes on slow-moving data, this wastes capacity and adds load on source systems.
Implement row-level security wherever different users should see different data. Do not rely on separate reports per audience when RLS can serve the right data to each user from a single governed report.
Monitor usage with the built-in usage metrics. The Service provides usage metrics showing who is viewing what and how often, use this to identify unused reports and confirm that important content is reaching its audience, as discussed in 10 Power BI Dashboard Best Practices.
Establish a clear workspace naming and structure convention. As the number of workspaces grows, a consistent naming convention prevents the Service from becoming disorganized and hard to navigate.
Common Beginner Mistakes
Confusing publishing with sharing. Publishing a report to a workspace makes it available in the Service, but it does not automatically share it with others. Sharing is a separate, deliberate step. Many beginners publish a report and assume colleagues can see it, when no access has actually been granted.
Relying on My Workspace for team content. Building important reports in My Workspace makes them difficult to share and collaborate on, and ties them to a single individual’s account. Team content belongs in shared workspaces from the start.
Forgetting the gateway for on-premises data. Publishing a report built on an on-premises data source and then finding that scheduled refresh fails is one of the most common beginner frustrations. On-premises sources require a configured data gateway.
Sharing individual items instead of using apps. Sharing dozens of individual reports and dashboards becomes unmanageable quickly. Apps solve this, but beginners often do not discover them until sharing has already become chaotic.
Misunderstanding licensing requirements. Assuming that publishing to the Service is enough for others to view content, without realizing that sharing generally requires Pro licenses (or Premium capacity), leads to confusion when colleagues cannot access shared reports.
Over-refreshing datasets. Setting every dataset to refresh at the maximum frequency, regardless of how often the underlying data actually changes, wastes capacity and places unnecessary load on source systems.
Ignoring row-level security. Building separate reports for each audience when row-level security could serve appropriate data to each user from one governed report creates unnecessary maintenance and governance risk.
Conclusion
The Power BI Service is what transforms Power BI from a personal reporting tool into an organizational reporting platform. It is where reports are published, organized into workspaces, secured with row-level security, kept current through scheduled refresh and the data gateway, distributed at scale through apps, and delivered to any device through the mobile app.
For anyone moving beyond building reports on their own laptop, understanding the Service is the essential next step. The workflow is consistent regardless of scale: build in Desktop, publish to a workspace, configure refresh and security, and distribute through apps. The hospital example shows these same principles handling a genuinely complex, governance-sensitive, multi-department environment, which is exactly what the Service is designed for.
Start by moving your most important report out of My Workspace into a proper shared workspace, configuring scheduled refresh, and distributing it through an app. That single sequence captures the core value the Power BI Service provides. Continue your learning with Power BI Data Modeling Explained and Power Query in Power BI Explained to strengthen the foundations beneath every report you publish.
Frequently Asked Questions
The Power BI Service is the cloud-based platform, accessed at app.powerbi.com, where Power BI reports and dashboards are published, shared, secured, and consumed. It is the online software-as-a-service part of Power BI, hosted by Microsoft, requiring no installation, and used for collaboration and distribution across an organization.
The Power BI Service has a free tier that allows individuals to publish to their own personal Workspace. Still, free users generally cannot share content with others or consume content shared by others. Sharing and collaboration require a Power BI Pro license, or content hosted in Premium capacity, which allows free users to consume it.
Power BI Desktop is a free Windows application used to build reports, connect data, model, write DAX, and design visuals. The Power BI Service is the cloud platform where those reports are published, shared, refreshed, and consumed. Desktop is for authoring; the Service is for distribution and collaboration.
The Power BI Service offers limited web-based report editing, but serious report authoring, data modeling, complex DAX, and Power Query transformations are done in Power BI Desktop. Dashboards, however, can only be created in the Service, because they are assembled from tiles pinned out of published reports.
A workspace is a container in the Power BI Service where a team stores, develops, and manages related reports, dashboards, and datasets. Access is controlled by four roles: Admin, Member, Contributor, and Viewer. Workspaces are the collaboration environment where content is built before being distributed to end users through apps.
A dashboard is a single-page canvas, created only in the Power BI Service, made up of tiles pinned from one or more reports. It provides an at-a-glance summary and can combine visuals from multiple reports and datasets onto one screen. Dashboards are designed for monitoring, with click-through to the underlying reports for detail.
A Power BI data gateway is software installed on-premises that acts as a secure bridge, allowing the cloud-based Power BI Service to connect to data sources inside an organization’s network. It enables scheduled refreshes of on-premises data, such as internal SQL Server databases, without exposing those sources directly to the internet.
In most cases, sharing Power BI reports requires both the sender and recipient to have a Pro license. The exception is content hosted in Power BI Premium or Fabric capacity, which allows users without individual Pro licenses to consume shared content. Free-tier users generally cannot share or receive shared content.
Yes. The Power BI Service works on mobile through dedicated Power BI apps for iOS and Android. These apps let users view dashboards and reports, receive data alerts, and interact with content on phones and tablets. Report authors can design dedicated mobile layouts so content displays correctly on smaller screens.
4 thoughts on “Power BI Service Explained: Everything You Need to Know”