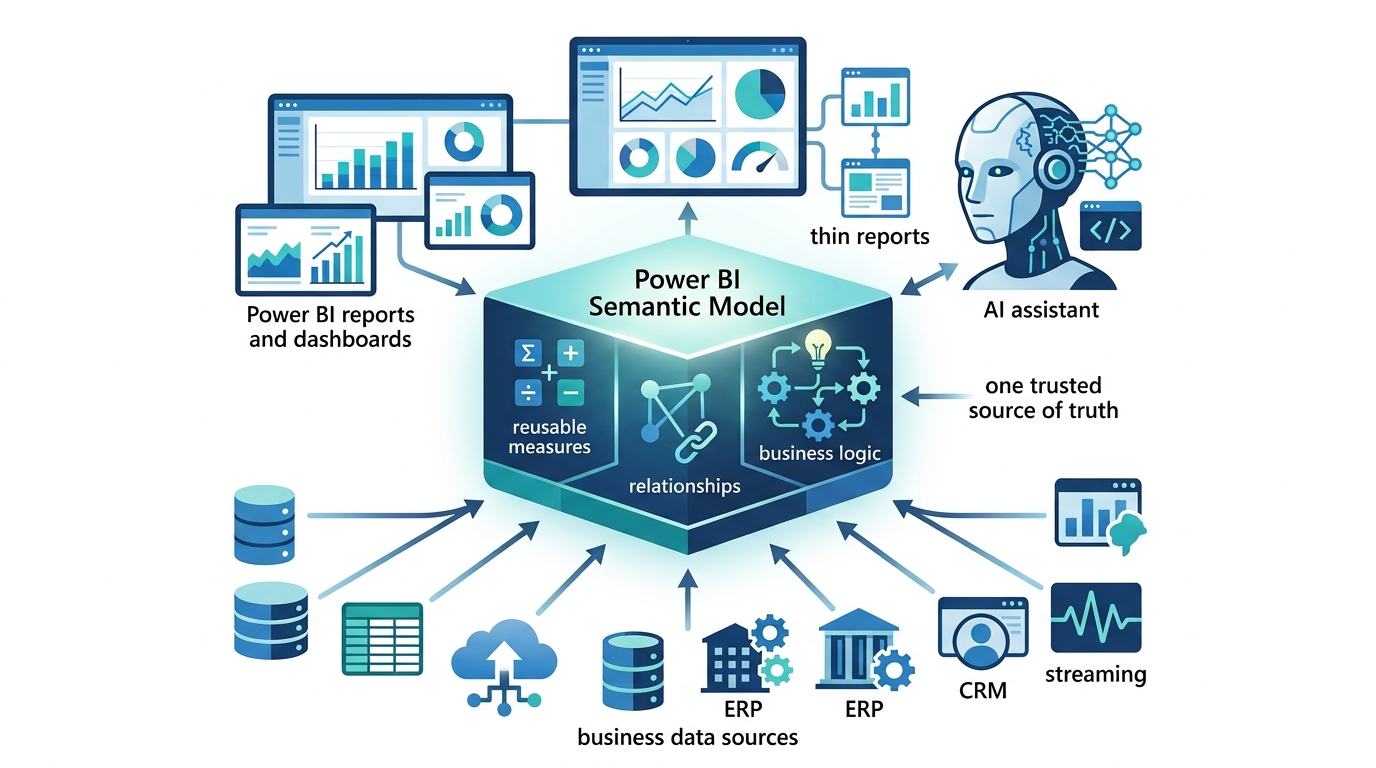
Almost everything you build in Power BI ultimately rests on one thing: the semantic model. Every report, every dashboard, and increasingly every Copilot answer draws its numbers and its business logic from a semantic model underneath. Therefore, if you want to move from building one-off reports to building trusted, enterprise-wide analytics, you first need to understand what a Power BI semantic model is and how it works. This guide starts from the basics and builds all the way up to enterprise practice.
Key Takeaways
- A Power BI semantic model is the data-and-logic layer that sits beneath reports, holding tables, relationships, and measures so visuals can ask business questions.
- Microsoft renamed “datasets” to “semantic models” because the object always did far more than store data; it carries the business logic too.
- One shared semantic model can power many reports, so teams reuse the same measures and KPIs instead of rebuilding them, which creates a single source of truth.
- In Microsoft Fabric, semantic models connect to OneLake and support Direct Lake, and they also ground Copilot so AI answers reflect certified business logic.
- Enterprises govern semantic models through endorsement badges, Promoted, Certified, and Master data, plus lineage and security, to keep reporting consistent and trusted.
This article builds on Power BI Data Modeling and Direct Lake Explained. If those concepts are new to you, skim them first, because a semantic model brings them together into one reusable layer.
What Is a Power BI Semantic Model?
A Power BI semantic model is the layer that holds your data together with the business logic that gives it meaning. In practice, it contains the tables you load, the relationships between them, and the measures and calculations that turn raw numbers into answers. When a report shows “total revenue by region,” it asks the semantic model for that answer, and the model supplies it.

Think of the semantic model as a translator between raw data and business questions. Analysts call this a semantic layer, because it maps technical tables and columns to meaningful business concepts such as revenue, uptime, or admissions. As a result, report builders do not need to rewrite the same logic every time. Instead, they build on definitions the model already provides. This single idea, business logic living in one reusable place, sits at the heart of everything that follows.
Why Microsoft Renamed Datasets
For years, Power BI called this object a “dataset.” However, that name undersold what it actually did. A dataset never simply stored data; it also held relationships, measures, hierarchies, and security rules. Therefore, in late 2023 Microsoft renamed datasets to “semantic models” to reflect that fuller reality.
The new name matters because it changes how people think about the object. “Dataset” suggested a passive bucket of rows. “Semantic model,” by contrast, signals an active layer of meaning, one that encodes business logic and drives consistent answers. Consequently, the rename nudged teams toward treating the model as a shared, governed asset rather than a throwaway file attached to a single report.
| Feature | Dataset (old name) | Semantic Model |
|---|---|---|
| Stores data | Yes | Yes |
| Business logic | Limited concept | Central purpose |
| Enterprise ready | Limited framing | Yes |
| Shared across reports | Yes | Yes |
| Fabric integration | Basic | Full |
| Copilot ready | Limited | Yes |
Importantly, the rename changed the label, not the technology. Your existing datasets became semantic models automatically, so nothing broke. Even so, the shift in language reinforced a shift in mindset, and that mindset increasingly shapes how enterprises design analytics on Fabric.
Semantic Model vs Data Model
People often use “data model” and “semantic model” interchangeably, yet a useful distinction exists. A data model describes how tables relate structurally, the facts, dimensions, and relationships you design during data modeling. A semantic model includes that data model but adds the business layer on top: the measures, KPIs, hierarchies, and definitions that give the structure meaning.
In other words, the data model answers “how is the data connected?” while the semantic model answers “what does the business want to know?” Because the semantic model wraps the data model inside a business layer, it becomes the object that reports actually consume. For example, a data model links a sales fact table to a date dimension; the semantic model then defines “year-over-year growth” as a reusable measure on top of that link.
So when you build well in Power BI, you always do both at once. First, you shape a solid data model. Then, you enrich it with business logic to form a complete semantic model. The rest of this guide focuses on that enriched, business-ready layer.
Semantic Model Architecture
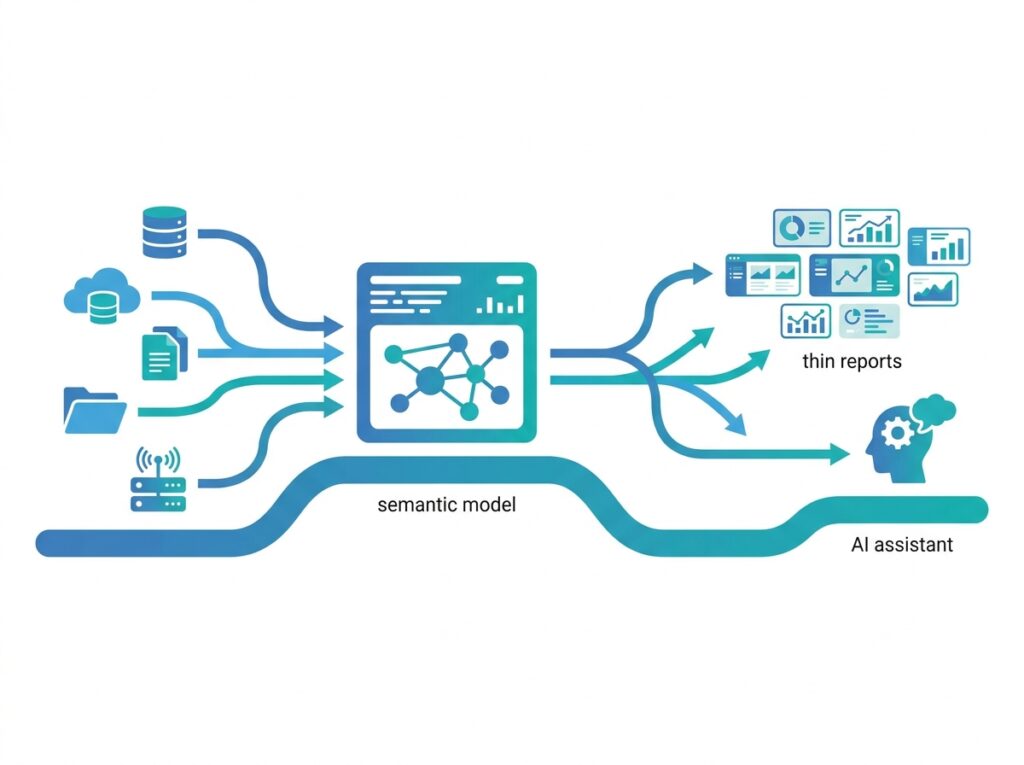
The architecture of a semantic model sits neatly between your data sources and your reports. Data flows up from the source, into the model, and out to the visuals, while the model applies structure and logic along the way.
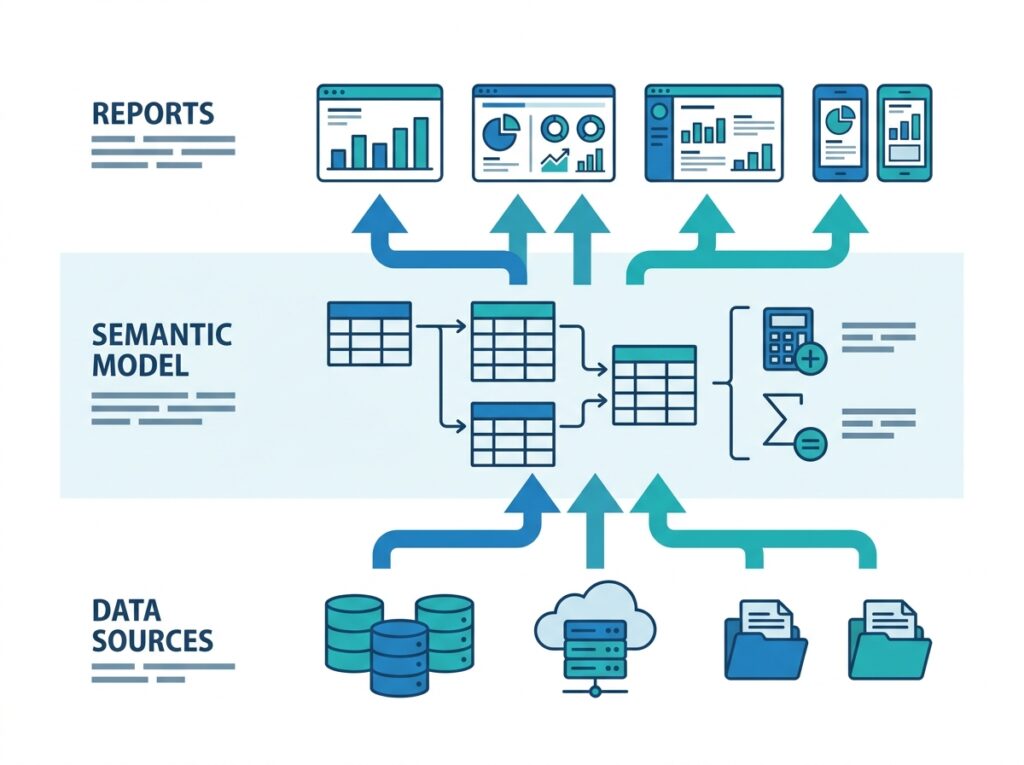
At the bottom sit your sources, which might include databases, files, or, in Fabric, Delta tables in OneLake. In the middle sits the semantic model, which loads or connects to that data and layers relationships and measures over it. At the top sit the reports, which query the model rather than the raw source. Because many reports can point at one model, this architecture naturally supports reuse.
The model also chooses how it accesses data, and that choice defines its storage mode. It can import the data, query it live through DirectQuery, or read it directly from OneLake through Direct Lake. Whichever mode it uses, the reports above stay the same, because they only ever talk to the model. Consequently, you can change the underlying access strategy without rebuilding every report.
Components of a Semantic Model
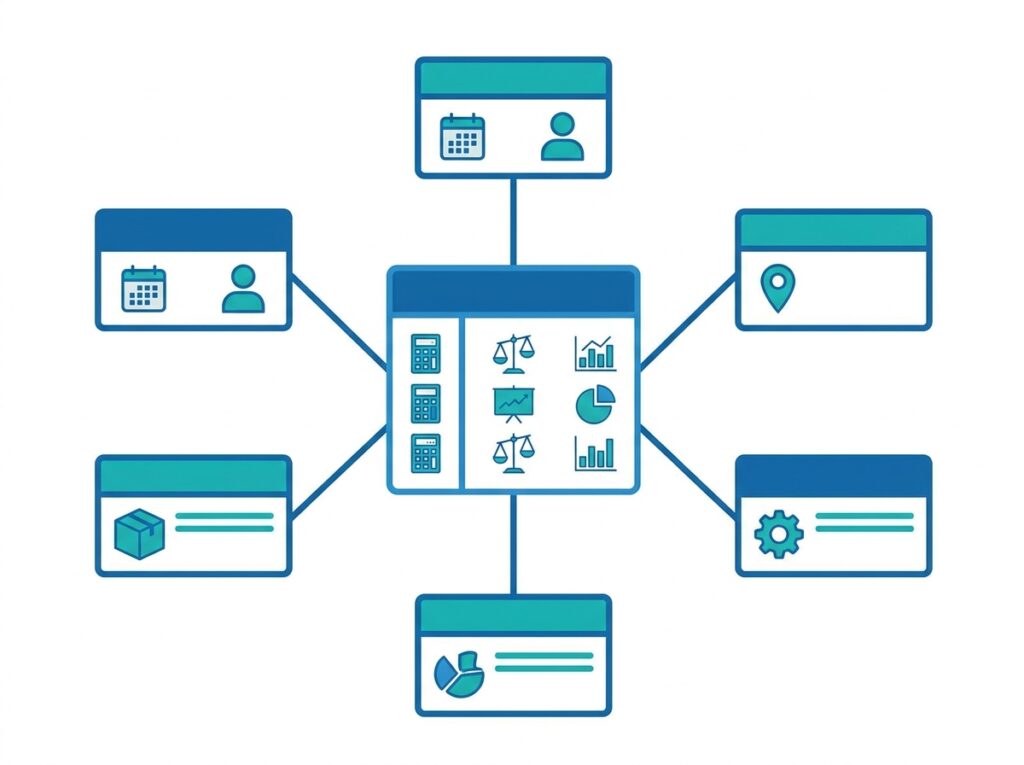
A semantic model brings several building blocks together. Each one plays a specific role, and together they turn raw tables into a business-ready layer.
Tables
Tables hold the data itself. Typically, you organize them into fact tables, which store events like sales or admissions, and dimension tables, which store descriptive context like dates, products, or departments. This fact-and-dimension structure keeps the model clean and fast.
Relationships
Relationships connect tables so the model can combine them correctly. For instance, a relationship links each sale to a date, which lets a report slice revenue by month. Because relationships define how data joins, they shape every result the model returns.
Measures
Measures are calculations written in DAX, and they carry the model’s business logic. A measure such as “total revenue” or “average equipment uptime” runs whenever a report needs it. Crucially, you define a measure once, and every report reuses it, which keeps numbers consistent everywhere.
Hierarchies
Hierarchies arrange related fields into drill paths, such as Year to Quarter to Month, or Region to Hospital to Department. As a result, users can drill down naturally inside a visual without extra setup each time.
KPIs
KPIs track a value against a target, which makes performance easy to read at a glance. For example, a KPI might compare actual uptime against a 98% target. Because the model defines the KPI centrally, every dashboard shows the same target and the same status.
Perspectives
Perspectives show tailored, simplified views of a large model to specific audiences. Therefore, a finance team can see only the tables and measures relevant to them, even though the model contains far more. This keeps big enterprise models approachable.
Calculation Groups (Overview)
Calculation groups let you apply one reusable calculation pattern across many measures at once. For instance, a single time-intelligence group can add year-to-date and prior-year logic to every measure, instead of you writing those variations by hand. As a result, large models stay maintainable rather than sprawling into hundreds of near-duplicate measures.
Building a Semantic Model
Building a semantic model follows a clear sequence, and each step prepares the next. First, you connect to your data and shape it using Power Query, cleaning and transforming it before it enters the model. Good preparation here pays off later, because a clean input produces a clean model.
Next, you design the tables and relationships, usually as a star schema of facts and dimensions. Then, you add measures in DAX to encode the business logic your reports need. After that, you enrich the model with hierarchies, KPIs, and, where helpful, calculation groups. Finally, you test the model against real questions to confirm it returns correct, consistent answers.
Throughout this process, you should think beyond a single report. Because one model can serve many reports, a little extra care in naming, structure, and documentation makes the model reusable across your whole team. In short, you are not just building a report; you are building a shared foundation.
Shared Semantic Models
A shared semantic model is one that many reports connect to at once, and it unlocks the biggest benefit of the whole concept. Instead of every analyst building a separate model with its own copy of the logic, the team builds one model and reuses it everywhere.
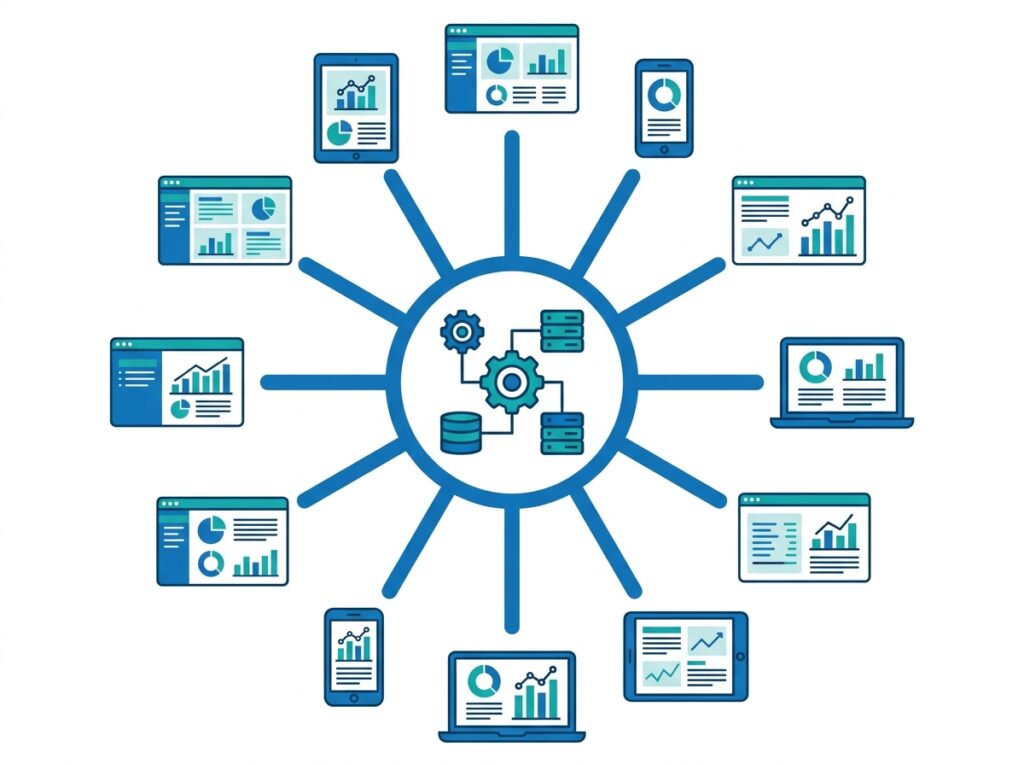
The payoff is consistency. Because every report reads the same measures, everyone reports the same numbers. When someone updates a definition, say, how the team calculates “active patients”, that change flows to every connected report at once. Consequently, teams avoid the classic problem where finance and operations quote different figures for the same metric.
Shared models also speed up development. A new report author does not rebuild the data foundation; instead, they connect to the trusted model and focus purely on visuals. Therefore, reports appear faster, and maintenance shrinks, since one model replaces many. For enterprises, this reuse is exactly why semantic models matter so much.
Live Connection
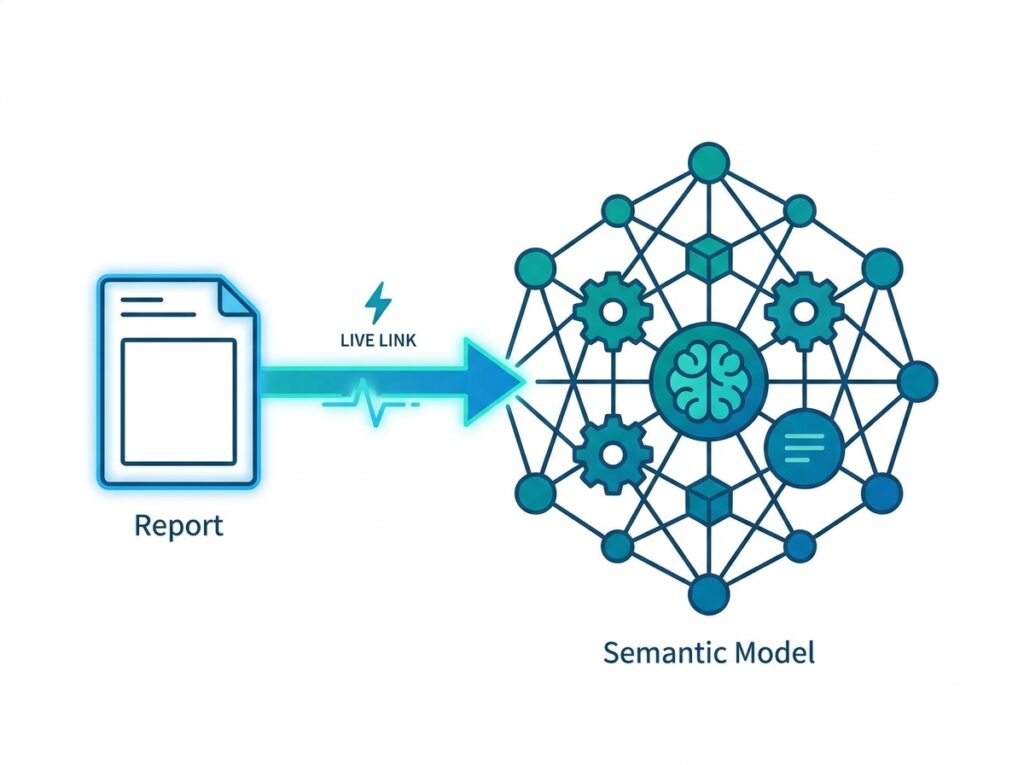
Live Connection is how a report connects to a shared semantic model without copying any data. When a report uses Live Connection, it holds no data of its own; instead, it reads everything from the central model in real time. As a result, the report always reflects the model’s current definitions and data.
| Feature | Import | Live Connection |
|---|---|---|
| Stores its own data | Yes | No |
| Speed | Very fast | Depends on the model |
| Needs its own refresh | Yes | No |
| Shares business logic | Partial | Full |
| Enterprise BI fit | Good | Excellent |
Notice how Live Connection differs from Import. An Import report copies and refreshes its own data, whereas a Live Connection report relies entirely on the shared model. Because the model owns the data and logic, Live Connection reports stay light, consistent, and easy to maintain. For enterprise reporting, therefore, Live Connection pairs perfectly with shared semantic models.
Thin Reports Explained
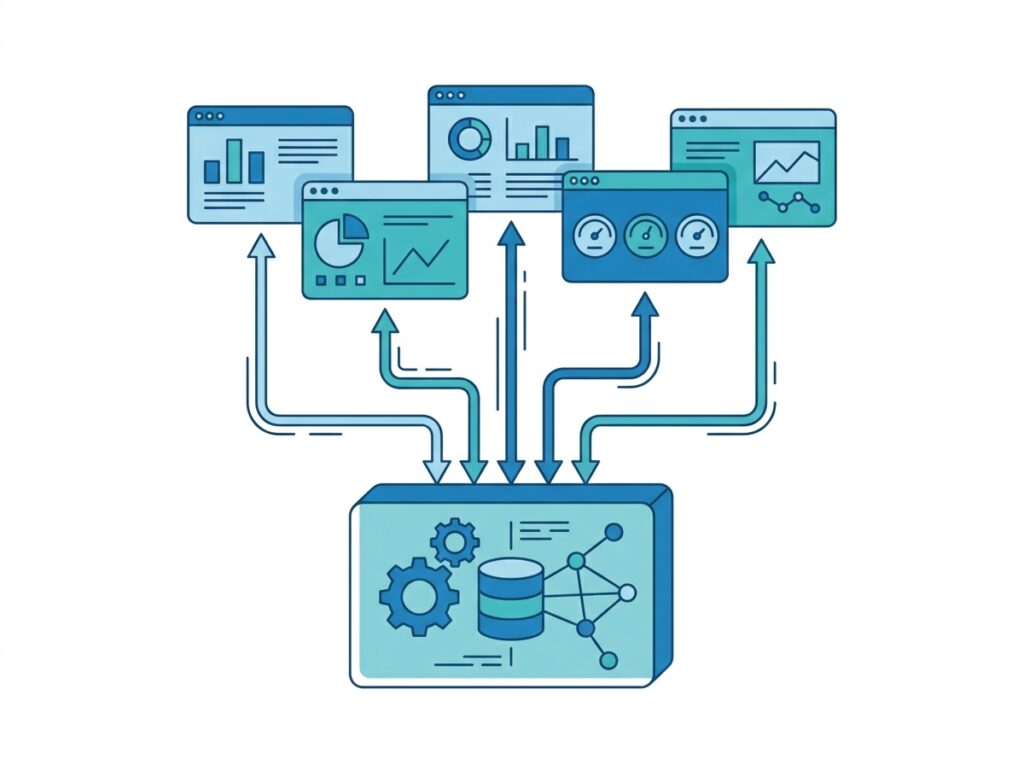
A thin report is a report that contains only visuals and connects to a shared semantic model for its data and logic. Because it stores no data itself, it stays “thin.” This pattern follows directly from Live Connection, and it has become the recommended enterprise approach.
| Feature | Thin Report | Traditional Report |
|---|---|---|
| Stores its own data | No | Yes |
| Uses shared semantic model | Yes | No |
| Faster development | Yes | Slower |
| Easier maintenance | Yes | Harder |
| Enterprise recommended | Yes | Partial |
The advantages stack up quickly. First, thin reports develop faster, since authors skip the data work and focus on visuals. Second, they maintain easily, because the logic lives in one model rather than scattered across many files. Third, they guarantee consistency, since every thin report reads the same measures. Consequently, large organizations often standardize on one certified model plus many thin reports, which keeps their whole reporting estate coherent.
Semantic Models in Microsoft Fabric
In Microsoft Fabric, semantic models become even more central, because they connect directly to the unified platform. A semantic model lives in a Fabric workspace and reads data from OneLake, so it sits naturally alongside Lakehouses, warehouses, and every other Fabric workload.
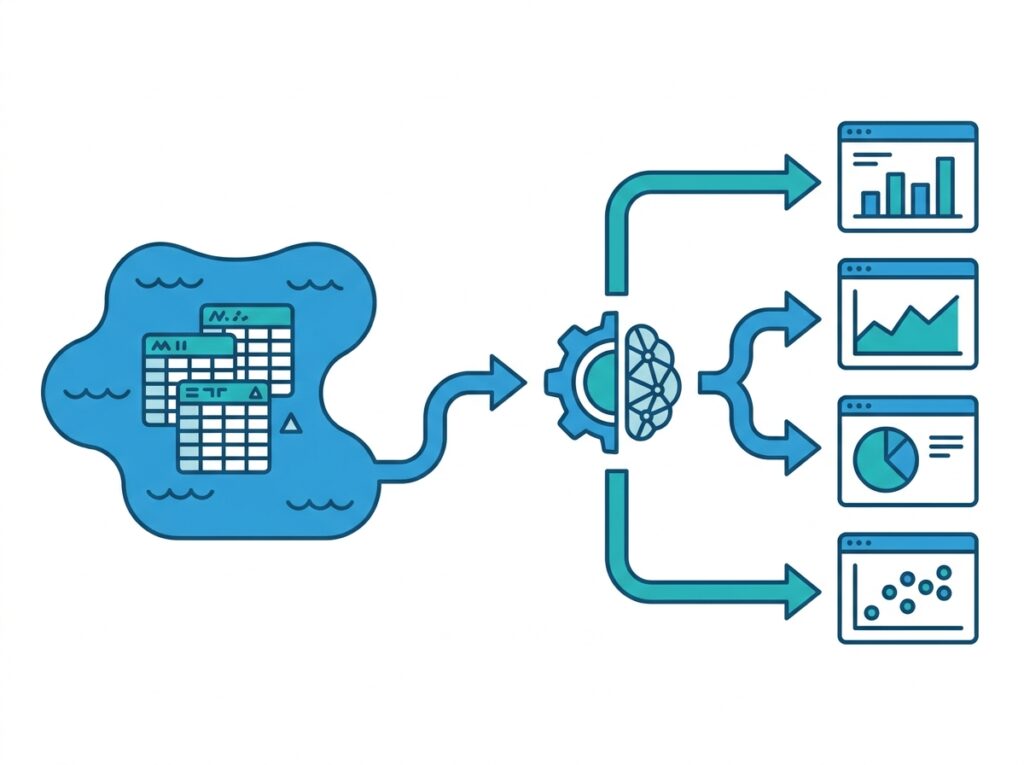
Because the model reads OneLake directly, data flows cleanly from the lake, through the semantic model, and out to every report. As a result, the model becomes the single business layer that the whole Fabric estate shares.
This integration also connects semantic models to Copilot. When you ask Copilot a question about your data, it grounds its answer in the semantic model’s measures and definitions, rather than guessing. Therefore, the quality of your Copilot answers depends directly on the quality of your model. A well-built, certified model gives trustworthy AI answers, while a messy one produces messy results.

Increasingly, then, the semantic model acts as the trusted grounding layer for AI across the platform. As organizations adopt Copilot and AI agents, they discover that reliable AI starts with reliable semantic models. In Fabric, consequently, investing in a strong model pays off twice: once for reports and again for AI.
Direct Lake + Semantic Models
Direct Lake and semantic models work together closely, because Direct Lake is a storage mode that a semantic model can use. When a model uses Direct Lake, it reads Delta Parquet data straight from OneLake, which combines Import-like speed with near real-time freshness and no scheduled refresh.
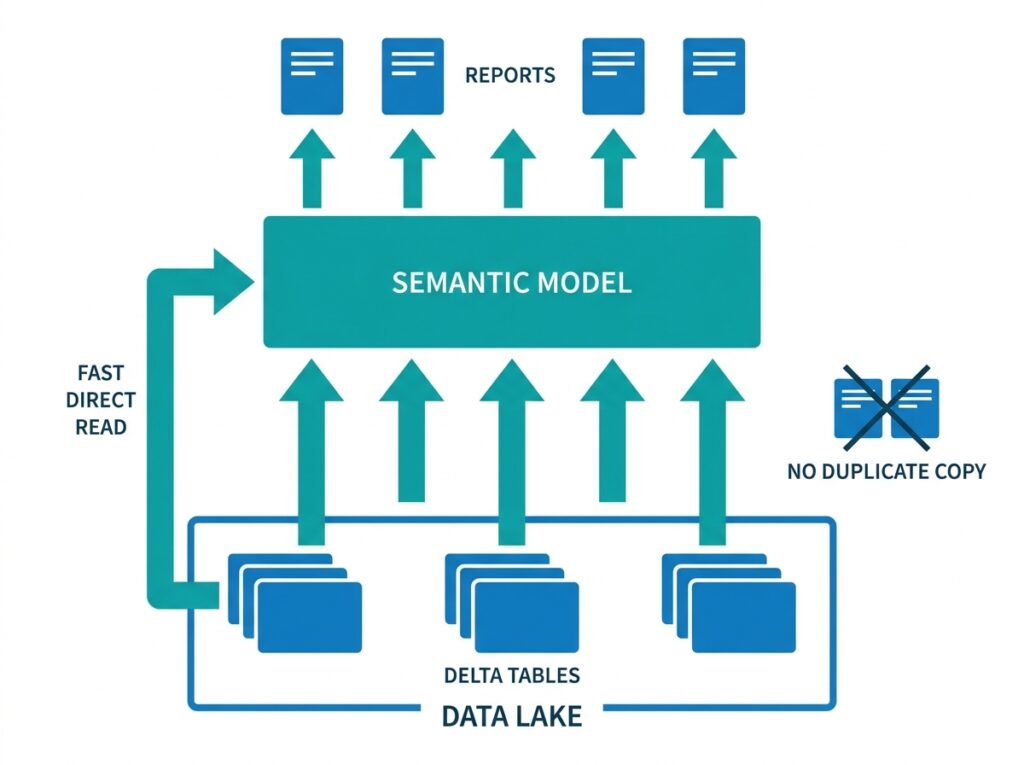
The pairing is powerful for enterprises. Because the model reads OneLake directly, it avoids copying millions of rows and skips the nightly refresh, as the Direct Lake guide explains in depth. Meanwhile, the model still provides all its usual business logic, measures, relationships, and KPIs, on top of that fresh data. So you get freshness and reuse together.
Of course, Direct Lake is not the only option. A semantic model can still import data or use DirectQuery when those modes suit the situation better. Nevertheless, when your data already lives in OneLake, Direct Lake usually gives the best blend of speed, freshness, and simplicity, which is why Fabric teams reach for it first.
Governance and Security
Governance turns a useful model into a trusted enterprise asset, and Power BI provides several tools for it. The most visible is endorsement, which flags trustworthy models with badges so users can find them easily.
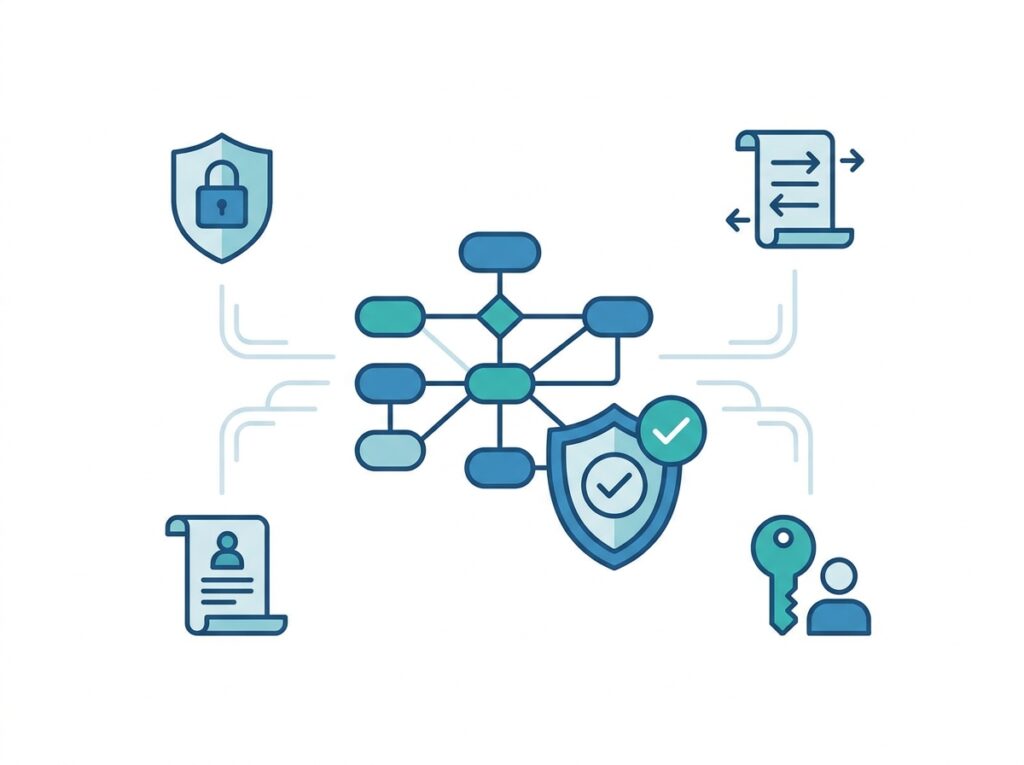
Power BI offers three endorsement levels. Promoted is a self-service badge that any model owner can apply to signal a model is ready to share. Certified is stricter: only authorized reviewers can certify a model, and a certified model shows a gold badge to mark it as meeting organizational standards. Newer still, the Master data badge marks core, single-source-of-truth data items. Together, these badges guide users toward the right, trusted models.
Beyond endorsement, governance includes lineage and security. Lineage view shows how data flows from source through the model to each report, which helps teams understand impact and debug issues. Meanwhile, row-level security, covered in Power BI Row-Level Security, restricts which rows each user can see. Because these controls live in the model, they apply consistently to every connected report. As a result, one governed model secures many reports at once.
Performance Considerations
A semantic model performs well only when you design it well, so a few principles matter greatly. First, keep the model lean. Because every extra column and table adds memory pressure, you should load only what your reports actually need.
Second, favor a clean star schema. A well-structured model of facts and dimensions queries faster and behaves more predictably than a tangled web of tables. Third, write efficient DAX, since a poorly written measure can slow every report that uses it. Therefore, the Performance Optimization guidance applies directly to semantic models.
Finally, choose the right storage mode for the situation. Import suits smaller, stable data; DirectQuery suits real-time operational sources; and Direct Lake suits large data already in OneLake. Because the storage mode shapes both speed and freshness, matching it to your needs delivers the best experience. In short, a fast model comes from deliberate design, not luck.
Hospital Analytics Example
To see why semantic models matter at scale, consider a large healthcare network that standardizes on one enterprise model. This example shows how a shared model turns scattered, inconsistent reporting into a single source of truth.
The Organization
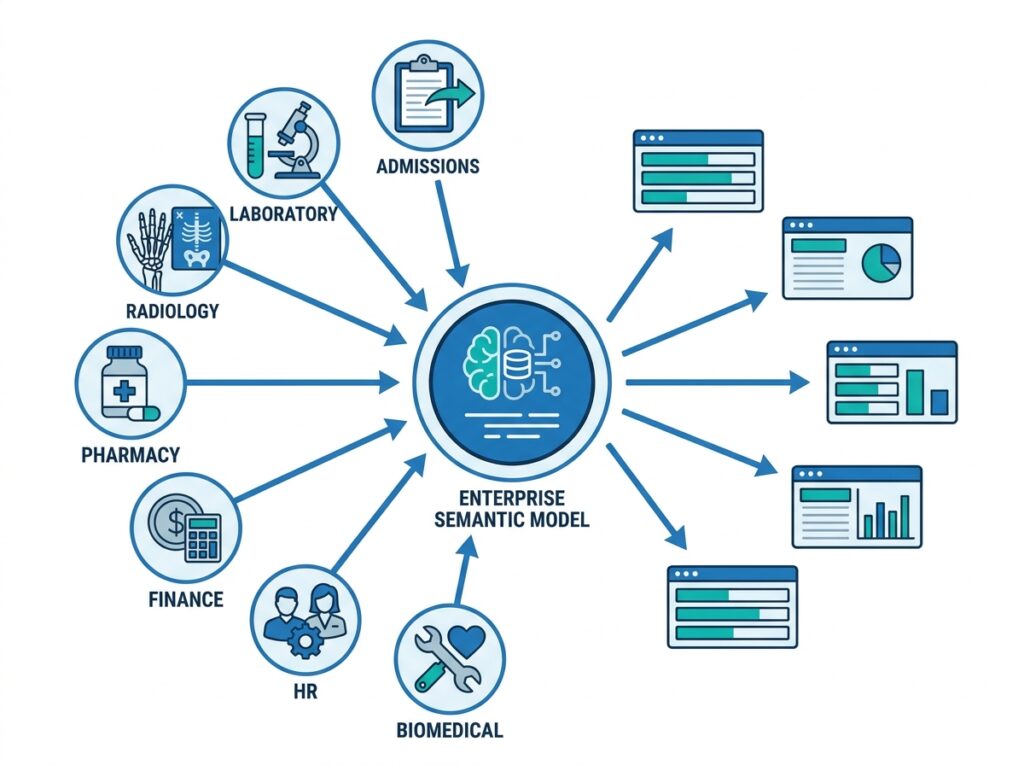
The network runs 40 hospitals with 3,500 medical devices, and its data spans laboratory, radiology, pharmacy, finance, HR, Biomedical Engineering, and patient admissions. Because so many departments report on overlapping data, consistency becomes a serious challenge.
Before the Shared Model
Previously, every department built its own Power BI reports independently. As a result, teams duplicated calculations and defined KPIs differently. One team calculated equipment uptime one way, while another used a different formula entirely. Consequently, executives received conflicting numbers, and no one trusted a single version. The organization had reports everywhere but consistency nowhere.
After the Shared Model
Then the network built one enterprise semantic model. It defined shared DAX measures and standard KPIs once, so every department used the same definitions. Executives, engineers, finance, and operations each still built their own reports; however, they all connected to the same model through Live Connection. Therefore, their reports differed in layout but agreed completely on the numbers.
The Results
The benefits followed naturally. The network gained consistent reporting, faster report development, and better governance, all at once. Moreover, teams stopped duplicating work, because they reused trusted measures instead of rebuilding them. Above all, the organization finally had trusted KPIs and true enterprise-wide analytics. In a healthcare setting, where a metric like equipment uptime can affect patient care, that consistency carries real weight.
Semantic Model Best Practices
Build one model per business domain. Rather than many overlapping models, create a single well-governed model for each domain, such as finance or operations. As a result, you avoid conflicting numbers and duplicated effort.
Design a clean star schema. Because facts and dimensions query efficiently, a tidy schema keeps the model fast and understandable. Therefore, resist the urge to flatten everything into wide tables.
Centralize measures and reuse them. Define each measure once, and let every report share it. Consequently, a change to a definition updates everywhere, and your numbers stay consistent.
Endorse and document trusted models. Promote and certify your best models, and document them clearly. Because users then find the right model easily, they stop building rogue copies.
Adopt thin reports on shared models. Encourage authors to connect to a certified model rather than import their own data. Thus, development speeds up and maintenance shrinks across the organization.
Common Mistakes
Building a separate model for every report. This habit creates model sprawl, and soon conflicting numbers appear everywhere. Instead, share one trusted model across many reports.
Duplicating the same measure repeatedly. When teams redefine “revenue” in every file, definitions drift apart. Therefore, centralize measures in one model so everyone calculates the same way.
Overloading the model with unused data. Extra tables and columns slow performance even when reports ignore them. Because a lean model runs faster, you should trim what you do not need.
Skipping governance. Without endorsement, lineage, and security, users cannot tell which model to trust. Consequently, they build their own, and sprawl returns. Govern early to prevent this.
Ignoring the storage mode. A model built in the wrong mode either goes stale or runs slowly. So match Import, DirectQuery, or Direct Lake to your data and freshness needs deliberately.
Conclusion
The semantic model is the quiet engine behind every Power BI report, and understanding it changes how you build analytics. Because it holds both the data and the business logic, it lets many reports share one trusted foundation. Microsoft renamed datasets to semantic models precisely to highlight this role, and in Fabric the model becomes more important still, connecting to OneLake, powering Direct Lake, and grounding Copilot.
For enterprises, the lesson is clear. Build one well-designed, well-governed model per domain, share it widely through Live Connection and thin reports, and endorse it so people trust it. As a result, your organization gains consistent numbers, faster development, and reliable AI answers, all from the same source of truth. The hospital example shows the payoff in practice: scattered, conflicting reports become one coherent analytics platform. Therefore, as you grow from single reports toward enterprise BI, invest in your semantic model first, because everything else builds on top of it.
Frequently Asked Questions
A Power BI semantic model is the layer that holds your data together with the business logic that gives it meaning. It contains tables, relationships, and measures, so reports can ask business questions like total revenue or equipment uptime and get consistent answers. In effect, it acts as a semantic layer that maps technical tables to meaningful business concepts, and every report sits on top of it.
Yes. A semantic model is simply the new name for what Power BI used to call a dataset. Microsoft renamed the object in late 2023, but the technology stayed the same, and existing datasets became semantic models automatically. The new name better reflects that the object always carried business logic, not just stored data.
Microsoft renamed datasets to semantic models because the old name undersold the object. A dataset never simply stored rows; it also held relationships, measures, hierarchies, and security. Therefore, the name semantic model reflects that the object is an active layer of business meaning, which encourages teams to treat it as a shared, governed asset rather than a throwaway file.
A thin report is a report that contains only visuals and connects to a shared semantic model for its data and logic. Because it stores no data itself, it stays lightweight. Thin reports develop faster, maintain more easily, and stay consistent, since every one reads the same measures from the shared model. For these reasons, enterprises often standardize on thin reports built on a certified model.
Live Connection is how a report connects to a shared semantic model without copying any data. The report holds no data of its own; instead, it reads everything from the central model in real time. As a result, the report always reflects the model’s current definitions and data, which makes Live Connection ideal for enterprise reporting on shared models.
Yes, and this is one of the biggest benefits of semantic models. Many reports can connect to a single shared model through Live Connection, so they all reuse the same measures and KPIs. Because everyone reads the same logic, everyone reports the same numbers, and a change to a definition flows to every connected report at once.
When you ask Copilot a question about your data, it grounds its answer in the semantic model’s measures and definitions rather than guessing. Therefore, the quality of Copilot answers depends directly on the quality of the model. A well-built, certified model produces trustworthy AI answers, which is why semantic models increasingly serve as the grounding layer for AI in Fabric.
Yes. Semantic models are fully integrated into Microsoft Fabric. A model lives in a Fabric workspace and reads data from OneLake, so it sits alongside Lakehouses, warehouses, and other workloads. In Fabric, a semantic model can also use Direct Lake to read OneLake data directly, and it grounds Copilot for AI-assisted analytics.
A certified semantic model is one that authorized reviewers have formally approved as meeting the organization’s quality standards. It carries a gold certification badge, which helps users identify the most trustworthy model. Certification is stricter than promotion, which any owner can apply. Enterprises typically restrict certification to a governance team, so a certified model signals a reliable single source of truth.
Use a shared semantic model whenever several reports need the same data and business logic. Because a shared model gives every report the same measures and KPIs, it guarantees consistency, speeds up development, and reduces maintenance. In enterprise settings, a shared model per business domain is usually the recommended approach, paired with thin reports that connect through Live Connection.