
There is a stage in every Power BI project that beginners underestimate until it stops everything. The data is imported. The tables are connected. The first visuals are on the canvas. Then the numbers look wrong duplicates inflating totals, inconsistent category names splitting what should be single values, date columns that Power BI refuses to recognise as dates.
The root of almost every one of these problems is the same: the data was not properly prepared before it entered the data model. Fixing it afterwards, inside DAX or within the visual settings, is like repainting a house built on a cracked foundation. The right place to fix data quality is before the model, during transformation and that is precisely what Power Query is designed to do.
Power Query in Power BI is the data preparation engine that sits between your raw data sources and your data model. Every cleaning step, every structural transformation, every standardisation decision happens here and it happens once, reproducibly, automatically on every refresh. Understanding Power Query is not optional for anyone who wants to build Power BI reports that are accurate and trustworthy.
This guide covers Power Query from first principles what it is, how the editor works, which transformations matter most, and how it relates to DAX. It includes a step-by-step data cleaning walkthrough and a dedicated example showing how Power Query handles the specific data quality challenges found in healthcare equipment maintenance records.
This article is part of the Zytriona Power BI learning series. If you have not yet read What Is Power BI?, Power BI vs Excel, Beginner’s Guide to DAX in Power BI, How to Build Your First Power BI Dashboard, or 10 Power BI Dashboard Best Practices, those articles provide the context that makes this one most useful.
What Is Power Query in Power BI?
Power Query is the data transformation and preparation tool built into Power BI Desktop. It allows users to connect to data sources, reshape and clean the data, and load it into the Power BI data model in a structured, repeatable format — all without writing code in most cases.
Technically, Power Query uses a language called M (also written as Power Query Formula Language) to record and execute every transformation step. In practice, most users never write M directly the Power Query Editor generates M code automatically behind the scenes as you apply transformations through its visual interface. The M script is always accessible if you need to inspect or edit it, but beginners can become fully productive in Power Query without ever opening it.
Power Query is not unique to Power BI. The same engine exists inside Microsoft Excel (as Power Query add-in and Get & Transform), Analysis Services, and Dataverse. Skills learned in Power Query for Power BI transfer directly to these other Microsoft tools.
Read more: Microsoft Power Query documentation
Why Power Query Matters
The quality of every Power BI report depends entirely on the quality of the data model beneath it. And the quality of the data model depends entirely on what happens in Power Query before the data is loaded.
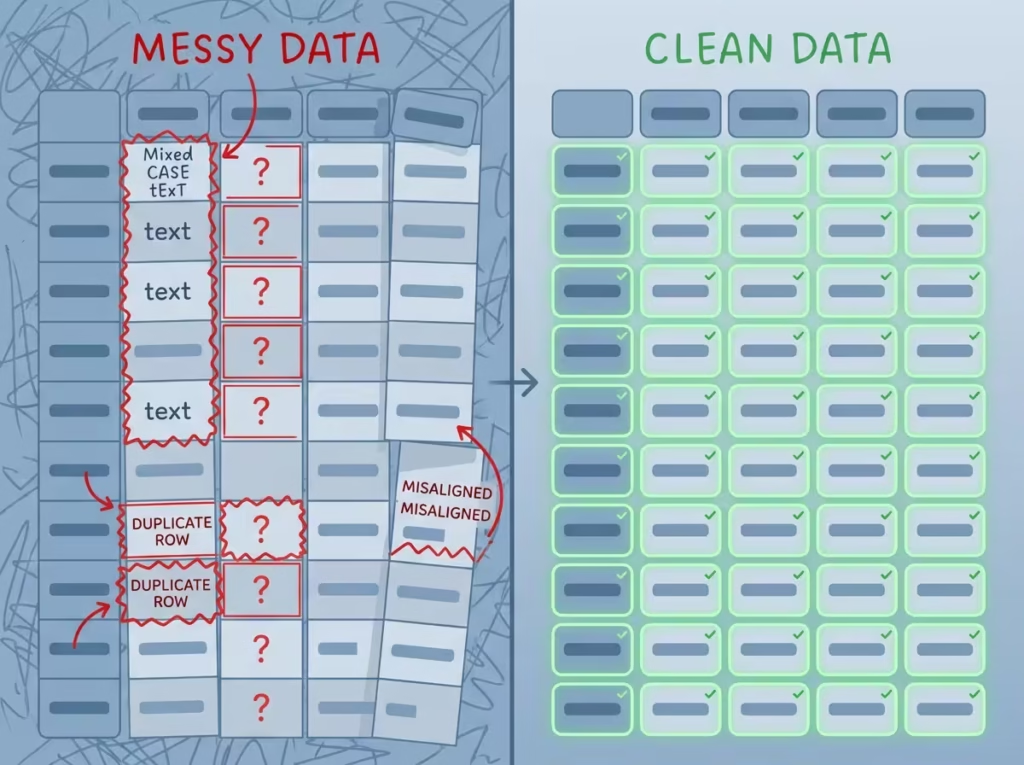
Raw data from real business systems is rarely report-ready. It arrives with inconsistent capitalisation, duplicate records, merged columns that should be separate, missing values, mismatched date formats, and structural layouts that make sense in the source system but are incompatible with how Power BI builds relationships.
Without Power Query, fixing these problems would require modifying the source data directly which is often not possible, creates governance risks, and is a manual step that must be repeated every time the data refreshes. Power Query solves this by applying every transformation step as a documented, automated sequence that runs against the source data on every refresh, producing a clean, consistently structured output without touching the original source.
This is the operational significance of Power Query: it makes data preparation automatic, reproducible, and auditable. For teams that have previously spent hours cleaning exported spreadsheets before building reports, Power Query is the tool that eliminates that process entirely.
Understanding ETL
ETL stands for Extract, Transform, Load. It is the standard framework that describes how data moves from its source into an analytical system and it maps directly onto what Power Query does in Power BI.
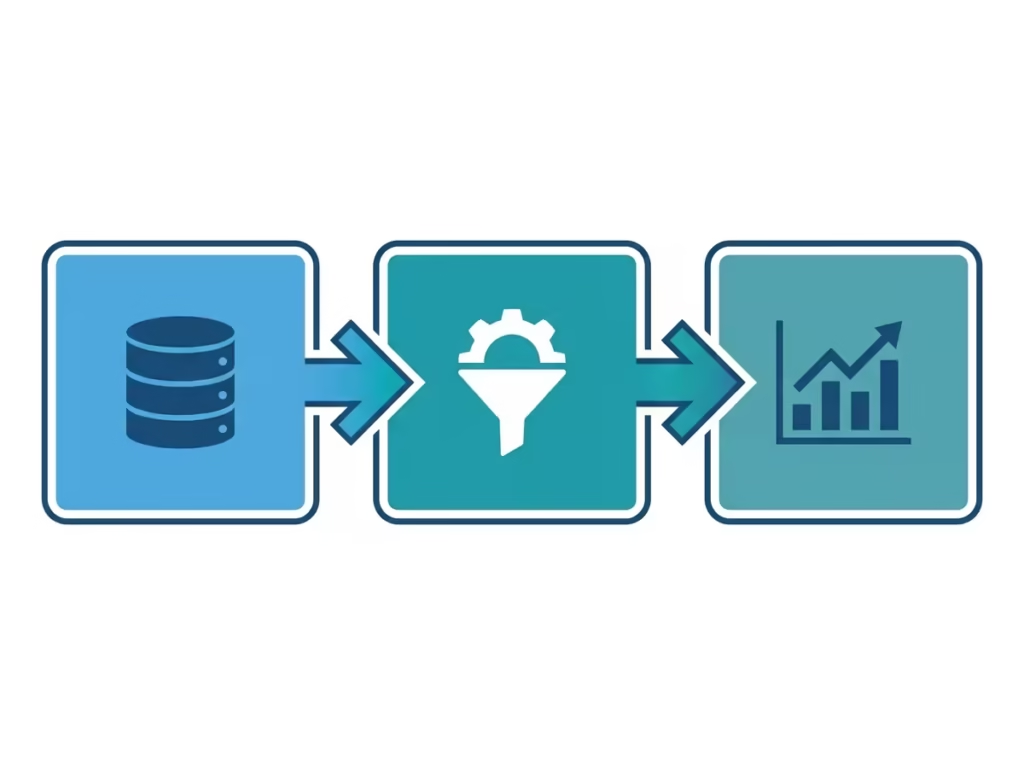
Extract is the process of connecting to a data source and pulling the raw data. In Power Query, this happens when you choose a connector Excel workbook, SQL Server database, SharePoint list, CSV file, API, or one of hundreds of other supported sources.
Transform is where the data is reshaped, cleaned, and structured. This is the core of Power Query’s functionality filtering rows, renaming columns, removing duplicates, merging tables, changing data types, splitting fields, pivoting and unpivoting data. Every step applied in the Power Query Editor is a transform step.
Load is the delivery of the transformed data into the Power BI data model, where it becomes available for relationships, DAX measures, and visualisation.
Understanding ETL as a concept helps clarify something that confuses many beginners: Power Query is not a reporting tool, and it is not a calculation tool. It is a preparation tool. Its job is to hand clean, correctly structured data to the data model. What the data model does with that data building relationships, computing measures is a separate stage with separate tools.
Power Query Editor Explained
The Power Query Editor is the interface where all transformation work happens. It opens as a separate window from Power BI Desktop when you choose to edit a query, and it has a layout designed around the idea that every transformation is a documented, reversible step.
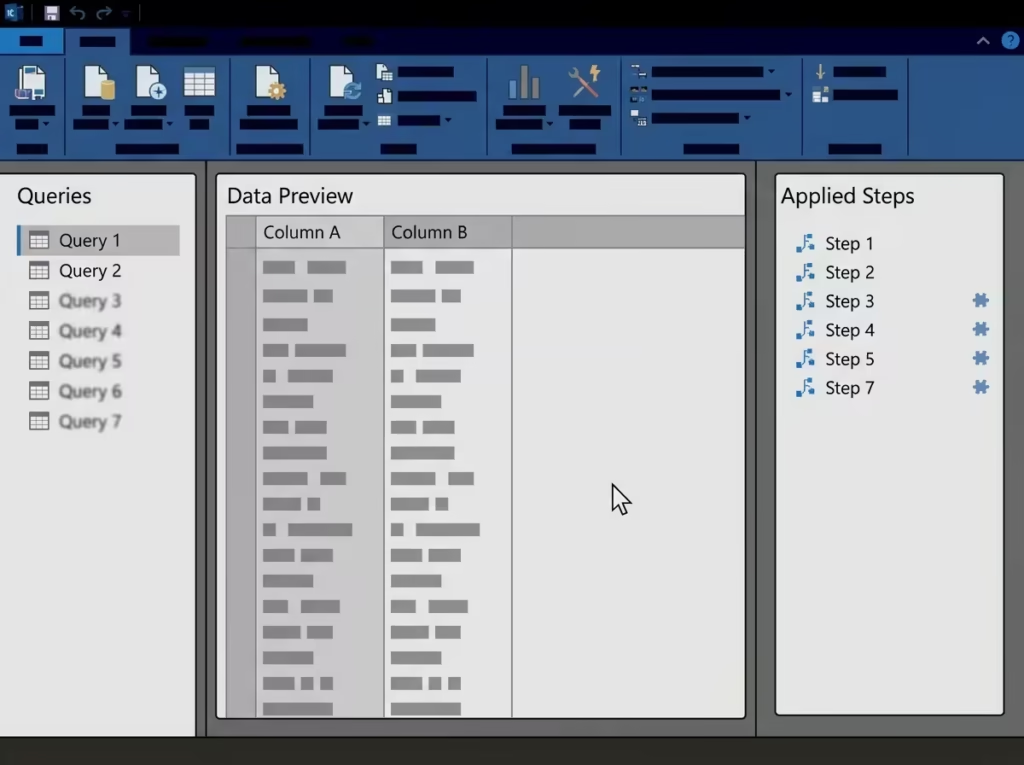
The main areas of the Power Query Editor:
Queries pane (left sidebar): Lists every query, effectively every table currently loaded or in progress. Clicking a query name switches the main editor view to that query.
Data preview (centre): Displays the current state of the selected query as a table, after all transformation steps applied so far have been executed. What you see here is exactly what will be loaded into the data model if you click Close & Apply.
Applied Steps pane (right sidebar): This is the most important panel in the Power Query Editor. It lists every transformation step applied to the current query in chronological order, from the initial Source step at the top to the most recent step at the bottom. Each step can be clicked, renamed, edited, or deleted. This is where the M code lives. Selecting any step and opening the formula bar shows the M expression that step generates.
Ribbon (top): Contains all available transformation commands organised into tabs Home, Transform, Add Column, View. Most standard transformations are accessible here without writing any M code.
The visual, step-by-step structure of the Applied Steps pane is what makes Power Query both powerful and auditable. Every change is recorded. If a step produces an unexpected result, you can click back to the previous step, examine the data state before the change, and either correct the problematic step or delete it. This reversibility is not possible when data is cleaned manually in a spreadsheet.
Connecting to Different Data Sources
Power Query in Power BI supports connections to over 200 data sources through a native connector library. The connection process follows the same basic pattern regardless of source type.

From Power BI Desktop, selecting “Get Data” from the Home ribbon opens the connector catalogue. Common source categories include:
File-based sources: Excel workbooks, CSV and text files, XML, JSON, PDF tables. These are typically the entry point for beginners most analysts already have data in Excel files.
Database sources: Microsoft SQL Server, Oracle, MySQL, PostgreSQL, Azure SQL Database, and many others. These connections typically require server address, database name, and authentication credentials.
Online services: SharePoint lists and document libraries, Salesforce, Google Analytics, Dynamics 365, Azure services, and REST APIs.
Microsoft platform sources: Power BI datasets, Dataverse, Analysis Services, Azure Data Lake Storage.
One important distinction beginners should understand is the difference between Import and DirectQuery connection modes. Import mode extracts the data and stores it inside Power BI’s in-memory engine Power Query’s full transformation capability is available in this mode. DirectQuery sends queries directly to the source database at report runtime some Power Query transformation steps are not available or behave differently in DirectQuery because the transformations must be translatable into the source database’s query language.
Essential Data Cleaning Techniques
Data cleaning in Power Query follows a consistent set of operations that address the most common data quality problems found in real business data. The following techniques cover the vast majority of cleaning work you will encounter.
Removing Duplicates
Duplicate rows inflate aggregated totals and create inaccurate relationship joins in the data model. In Power Query, duplicates can be removed at the full-row level or based on specific column values.
To remove duplicates: select the column or columns that together define a unique record, right-click the column header, and choose “Remove Duplicates.” Power Query adds a Remove Duplicates step and keeps only the first occurrence of each unique combination.
Changing Data Types
Every column in Power Query has a data type text, whole number, decimal number, date, date/time, true/false, and others. Power Query attempts to auto-detect types on import, but it frequently misassigns them particularly for date columns and numeric codes stored as text.
Incorrect data types cause DAX calculations to fail silently. A date column stored as text will not work with time intelligence functions. A revenue column stored as text cannot be summed. Fixing data types early in Power Query, not in the data model prevents a category of errors that are time-consuming to diagnose downstream.
To change a type: click the data type icon to the left of a column header and select the correct type from the dropdown.
Renaming Columns
Source system column names are frequently technical, abbreviated, or inconsistent with the naming conventions your data model will use. Rename columns in Power Query before loading to the model this keeps the model clean and ensures all downstream DAX measures and visuals reference meaningful, consistent names.
” To rename: double-click any column header in the data preview. “
Removing Unnecessary Columns
Loading only the columns your reports actually need reduces dataset size and improves refresh performance. Remove unused columns in Power Query rather than relying on hiding them in the data model.
To remove: select columns to keep, right-click, and choose “Remove Other Columns” or select columns to remove and choose “Remove Columns.”
Filtering Rows
Power Query can filter out rows that do not belong in the analytical dataset test records, null values, placeholder rows, or data outside a relevant time window.
To filter: click the dropdown arrow on any column header and apply filter conditions, exactly as in Excel AutoFilter. Multiple filter steps can be applied across different columns.
Handling Null and Missing Values
Null values need to be handled before data reaches the model. Options include replacing nulls with a default value (right-click a column → Replace Values, replace null with 0 or “Unknown”), removing rows where a critical field is null, or filling nulls downward from the value above (the Fill Down operation useful for merged cells exported from Excel).
Power Query Transformations Every Beginner Should Know
Beyond basic cleaning, Power Query provides a set of structural transformation operations that reshape data from how it arrives to how the data model needs it.
Splitting Columns:
A single column containing two pieces of information a product code and product name in the same cell, or a full name as first and last combined can be split into separate columns by delimiter, by number of characters, or by position.
Transform ribbon → Split Column → By Delimiter (choose comma, space, hyphen, or custom character).
Merging Columns:
The reverse of splitting: combining two columns into one. Useful when a first name and last name column need to become a single full name, or when a date part and time part are stored separately.
Add Column ribbon → Merge Columns → select separator.
Merging Queries (Joins):
Merging queries in Power Query is the equivalent of a SQL JOIN or Excel VLOOKUP it combines two tables based on a matching column value, bringing columns from the second table into the first.
Home ribbon → Merge Queries → select the key column in each table → choose join type (Left Outer, Inner, Full Outer, and others).
Merge is the right Power Query tool when you need to add reference data product names from a product table, customer regions from a customer table to a transaction table before loading to the model.
Appending Queries (Union):
Appending stacks one table on top of another, combining rows. This is useful when the same data structure exists across multiple files monthly sales exports stored as separate CSV files, for example and needs to be combined into a single unified dataset.
Home ribbon → Append Queries → select the tables to combine.
Pivoting and Unpivoting:
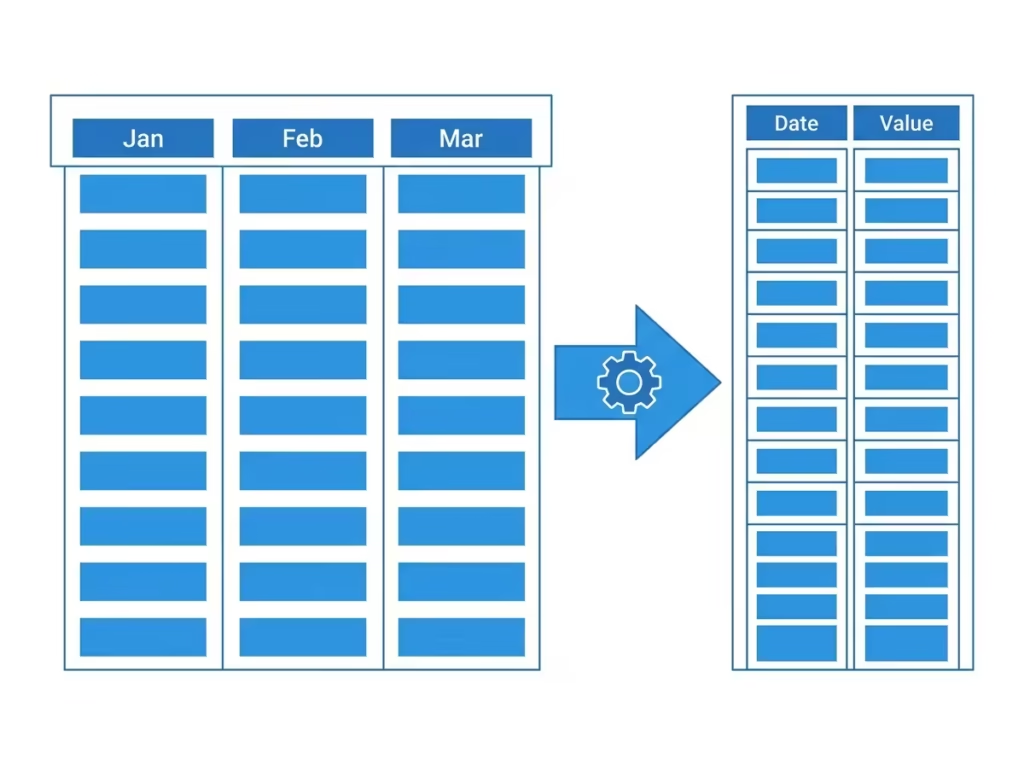
Pivoting converts rows into columns. Unpivoting converts columns into rows. This distinction matters because Power BI’s data model works best with data in a specific structure one column per attribute, one row per record (often called “narrow” or “tidy” format).
Data exported from accounting systems or ERPs frequently arrives in a “wide” format with months or dates as column headers rather than as values in a date column. Unpivoting that data in Power Query converts it into the structure Power BI and DAX expect.
Select the month or date columns → Transform ribbon → Unpivot Columns. Power Query creates two new columns: Attribute (the original column headers) and Value (the data values), replacing the wide format with a date-value pair structure.
Adding Custom Columns:
When a required field does not exist in the source data and cannot be created as a DAX measure (because it needs to participate in a table relationship or filter), a custom column in Power Query is the right approach.
Add Column ribbon → Custom Column → write the calculation using M formula syntax. Example:
= [Unit Price] * [Quantity]Custom columns are calculated row by row during the transform stage, before data loads to the model.
Conditional Columns:
A conditional column creates a new text or value column based on if-then logic applied to existing column values similar to an IF formula in Excel but applied during the preparation stage.
Add Column ribbon → Conditional Column → define the if-then rules through the visual interface without writing M code.
Power Query vs DAX
The most common conceptual confusion for Power BI beginners is understanding when to use Power Query and when to use DAX. They are complementary tools operating at different stages of the data pipeline, and they are not interchangeable.
| Feature / Task | Power Query | DAX |
|---|---|---|
| Data cleaning and standardisation | Yes | No |
| Removing duplicates | Yes | No |
| Combining tables from multiple sources | Yes | Limited |
| ETL — Extract, Transform, Load | Yes | No |
| Structural transformation (pivot, split, merge) | Yes | No |
| Data type correction | Yes | No |
| Creating calculated measures | No | Yes |
| Year-over-year and time intelligence calculations | No | Yes |
| Context-aware calculations (filter context) | No | Yes |
| Advanced aggregations and ratios | No | Yes |
| Runs at | Data refresh (before load) | Report render (after load) |
| Language | M (Power Query Formula Language) | DAX (Data Analysis Expressions) |
| Modifies data structure | Yes | No |
| Responds to report filters | No | Yes |
The practical rule: if the task involves changing the shape, structure, or quality of the data, it belongs in Power Query. If the task involves calculating something from the already loaded, already clean data, it belongs in DAX. Using DAX to work around data quality problems that should have been fixed in Power Query is the most common source of overcomplicated, fragile data models.
Step-by-Step Data Cleaning Example
The following walkthrough cleans a realistic messy sales export through a sequence of Power Query steps.
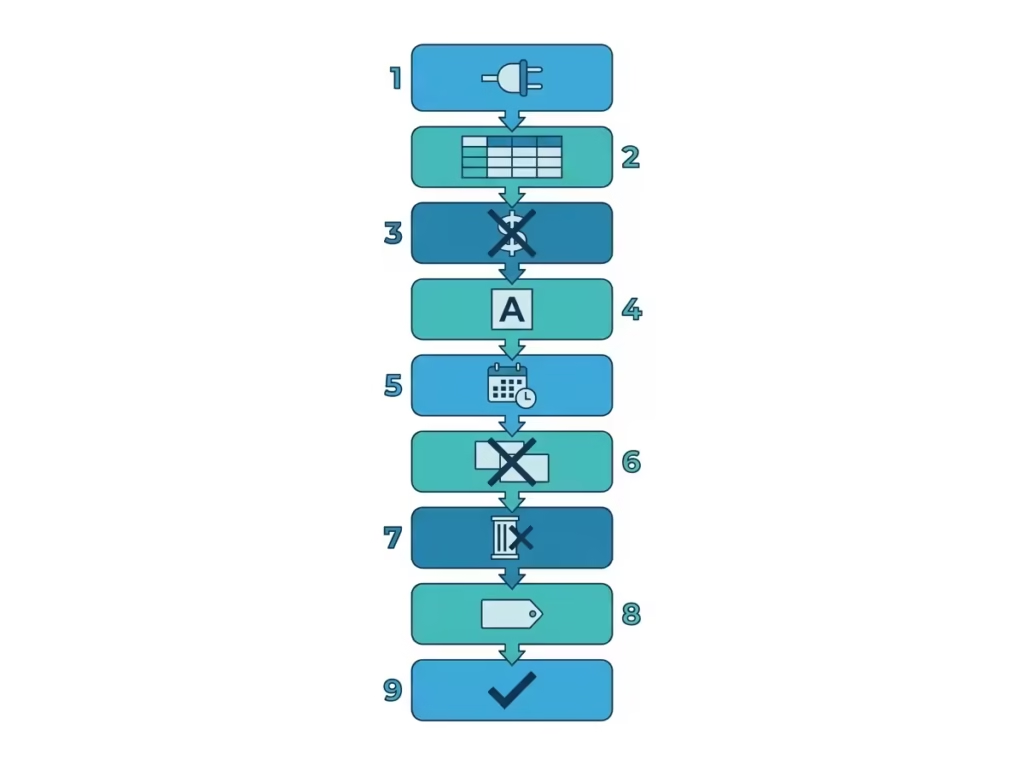
Starting data: A CSV export from a legacy sales system containing 45,000 rows. Problems include: the first three rows are header metadata, not column names; the revenue column is stored as text with currency symbols; the product category column has inconsistent capitalisation (“Electronics”, “electronics”, “ELECTRONICS”); the date column is formatted as text in DD/MM/YYYY format; and there are 312 duplicate order IDs.
Step 1: Connect and inspect: Get Data → Text/CSV → select the file. In the preview, confirm the data appears correctly, then select Transform Data to open the Power Query Editor rather than loading directly.
Step 2: Promote headers. The actual column names are in row 4, not recognised as headers. Home ribbon → Use First Row as Headers. Then delete the first three metadata rows using the Row Filters.
Step 3: Fix the revenue column: The revenue column shows values like “£1,250.00” stored as text. Replace Values to remove the “£” symbol and comma, then change the column data type to Decimal Number.
Step 4: Standardise product categories: Select the category column → Transform ribbon → Format → Capitalise Each Word. This converts all three variants (“Electronics”, “electronics”, “ELECTRONICS”) to a single consistent “Electronics” format.
Step 5: Fix the date column: The date column is text in DD/MM/YYYY format. Change the data type to Date Power Query will prompt for a locale if the format is ambiguous. Select “English (United Kingdom)” to parse DD/MM/YYYY correctly.
Step 6: Remove duplicates: Select the Order ID column → right-click → Remove Duplicates. The row count drops from 45,000 to 44,688, confirming the 312 duplicates were removed.
Step 7: Remove unnecessary columns: Remove any columns that are not needed in the data model internal system codes, timestamp fields at second precision, and legacy status flags using Remove Other Columns.
Step 8: Rename columns: Rename columns to the naming convention used throughout the data model: “Ord_ID” becomes “Order ID”, “Rev_GBP” becomes “Revenue”, “Cat_Desc” becomes “Product Category”.
Step 9: Load Close & Apply: Power Query executes all nine steps in sequence, applies them to the source data, and loads the clean result to the data model. On every future scheduled refresh, this same nine-step sequence runs automatically against the latest export.
Healthcare Data Cleaning Example: Medical Equipment Maintenance Records
This section addresses a specific data challenge that is rarely covered in standard Power Query tutorials but is operationally common in healthcare and facilities management environments: preparing medical equipment maintenance data exported from multiple source systems for a Power BI compliance dashboard.

The scenario is realistic and drawn from the kind of biomedical and facilities data environment where clean, accurate reporting carries regulatory and safety implications that commercial reporting contexts do not.
The Starting Problem
A hospital’s biomedical engineering department manages maintenance records across three separate systems:
- A CMMS (Computerised Maintenance Management System) that exports equipment records as CSV
- A legacy spreadsheet maintained by the overnight maintenance team
- A third-party vendor service portal that exports work orders as Excel files
Each system uses different equipment ID formats, different technician name conventions, and different date formats. The data cannot be trusted or combined without significant cleaning — yet the compliance dashboard depends on it being accurate, complete, and consistent.
Step 1: Append the Three Source Queries
Create three separate queries in Power Query, one for each data source. After initial cleaning within each query, append them into a single unified maintenance log using Home → Append Queries → Append as New.
Before appending, ensure all three queries share the same column names and data types. This is the most critical preparation step appending tables with mismatched column names creates a table where values shift into the wrong columns silently.
Step 2: Standardise Equipment IDs
The three systems use different equipment ID formats:
- CMMS uses “EQ-0042”
- The legacy spreadsheet uses “EQ0042” (no hyphen)
- The vendor portal uses “Equipment 42” (text prefix with space)
In Power Query, a custom column converts all three to a single canonical format:
= "EQ-" & Text.PadStart(
    Text.Select(
        Text.From([Equipment ID]),
        {"0".."9"}
    ),
    4,
    "0"
)
This formula extracts the numeric portion of the equipment ID from any of the three formats, pads it to four digits, and prepends “EQ-” producing “EQ-0042” consistently regardless of source.
Step 3: Remove Duplicate Work Orders
Each source system may contain partial records of the same work order, particularly for vendor-managed equipment where the CMMS and the vendor portal both record the same job. Remove duplicates on the Work Order ID column after appending, keeping the record with the most complete information (typically from the CMMS).
A conditional deduplication approach ranking records by data completeness and keeping the highest-ranked can be implemented through a Group By operation followed by a custom column, for cases where simple Remove Duplicates (which keeps only the first occurrence) would discard the better record.
Step 4: Clean Technician Names
Technician names across three systems include variations: “J. Smith”, “John Smith”, “SMITH, J”, and entries where the field is blank (work completed by an unrecorded contractor). A Conditional Column classifies each record:
if [Technician] = null or [Technician] = ""
then "External Contractor"
else Text.Proper([Technician])
Text.Proper Converts names to title case. The null handling ensures that unassigned records are labelled clearly rather than appearing as blank values in the dashboard, which would otherwise undercount in-house maintenance completions.
Step 5: Fix Missing Completion Dates
Records from the legacy spreadsheet have missing completion dates where the maintenance was recorded as complete, but the close date was not entered. Two strategies apply depending on the available data:
Where a “Date Completed” field is null but “Status” is “Complete” and “Date Reported” is available, fill the completion date with the reported date as a conservative approximation:
if [Status] = "Complete" and [Date Completed] = null
then [Date Reported]
else [Date Completed]
Where neither date is available, flag the record using a dedicated null-handling column so it can be surfaced in the dashboard as a data-quality exception rather than silently excluded from compliance calculations.
Step 6: Validate Equipment Categories
Equipment categories from the three systems use different hierarchies. A merge query joins the cleaned equipment ID column to a reference table (the organisation’s official equipment register) to retrieve the standardised category, department, and location for each piece of equipment. This replaces the inconsistent category values from each source system with a single governed reference dataset.
Step 7: Load to Data Model
After all seven steps, the appended and cleaned maintenance log is loaded to the Power BI data model as a single, trusted fact table. The query applies automatically on every scheduled refresh when a new export is dropped into the SharePoint folder each week, Power Query processes all seven steps without manual intervention, and the compliance dashboard updates with clean, consistent data.
This workflow illustrates the operational value of Power Query that no generic tutorial conveys: the ability to take genuinely messy, multi-source, governance-critical data and make it reliable and automatic. In a healthcare environment where the alternative is a manual weekly cleaning process, this represents a significant reduction in both analyst time and compliance risk.
Power Query Best Practices

Name every query clearly from the start: Power Query creates queries with default names like “Query1” and “Table (2)”. Renaming to descriptive, consistent names — “Sales_Transactions”, “Dim_Products”, “Ref_EquipmentRegister” — makes complex models with many queries navigable and maintainable.
Disable load for staging queries: When a query exists only to be merged or appended into another query not to be loaded to the data model directly, right-click it and uncheck “Enable Load.” This keeps the data model clean and reduces refresh time by not loading intermediate tables unnecessarily.
Apply filters early in the query sequence: Filtering rows near the top of the Applied Steps list (close to the Source step) reduces the volume of data that subsequent transformation steps must process. This matters significantly for large datasets and is related to the concept of query folding.
Understand query folding: Query folding occurs when Power Query can translate transformation steps back into a native query for the source database, allowing the database engine to do the filtering and processing rather than loading all data into Power Query first. When query folding is active, a step shows “View Native Query” in its right-click menu. Filters, column selections, and row operations generally fold; certain complex transformations break folding. Preserving query folding on large database sources significantly improves refresh performance.
Use parameters for flexible source paths: When a file path or database server name might change between environments (development, staging, production), define it as a Power Query parameter rather than hardcoding it into the source step. Parameters allow the source connection to be updated in one place rather than modified inside multiple queries.
Document transformation logic with step renames: Every step in the Applied Steps pane can be renamed from the default “Filtered Rows” to something descriptive like “Remove test equipment records (Status = Test).” This makes the query logic self-documenting and significantly reduces the time required to understand a query written weeks or months earlier.
Test with a reduced row count during development: When building and testing transformations on a large dataset, add a “Keep Top Rows” step at the beginning to limit the preview to 1,000 rows. Remove this step before final load. This prevents long waits during development while keeping the full dataset available for production.
Common Beginner Mistakes in Power Query
Cleaning data in the data model instead of Power Query: Using DAX calculated columns to fix data quality problems, replacing nulls, standardising text values, and correcting data types is less efficient, harder to maintain, and increases data model complexity unnecessarily. Data quality belongs in Power Query.
Loading every column from the source: Importing all columns from a wide source table and hiding unused ones in the data model is a common shortcut that inflates dataset size and degrades refresh and render performance. Remove unused columns in Power Query before loading.
Not renaming queries and steps: A Power Query model with six queries all named “Query (2)”, “Table”, and “Sheet1” is unmaintainable. The time invested in naming queries and steps clearly pays back immediately when debugging or updating the model.
Breaking query folding without knowing it: Adding a transformation step that cannot be folded to the source, typically a custom M function or certain text operations, silently disables folding for all subsequent steps in that query. For large database-sourced queries, this can dramatically increase refresh time without an obvious error message.
Merging when appending is needed, and vice versa: Merge combines columns from two tables on a matching key. Append stacks rows from two tables with the same structure. Confusing these produces either empty columns (merge applied when append was needed) or duplicated keys (append applied when merge was needed).
Ignoring data type assignment. Relying on Power Query’s auto-detected types without reviewing them is a common source of downstream errors. Always verify that date columns are typed as Date, numeric columns are typed as the correct number type, and text columns containing codes or IDs are explicitly typed as Text to prevent leading zeros from being dropped.
Official Microsoft Learn Program Here: Power Query training
Conclusion
Power Query is the foundation that everything else in Power BI sits on. A clean, correctly structured dataset entering the data model makes DAX measures simpler, relationship building straightforward, and dashboard visuals reliable. A dataset that skips proper Power Query preparation creates problems at every stage downstream problems that become progressively harder to diagnose and fix as the model grows in complexity.
For beginners, the most important mindset shift is understanding that the Power Query Editor is where data problems should be solved not in DAX, not in visual settings, and not by modifying source data directly. Every cleaning step applied in Power Query runs automatically and reproducibly on every refresh, making the entire reporting pipeline more reliable and far less dependent on manual intervention.
Start with the essential cleaning techniques covered in this guide: data types, removing duplicates, renaming columns, filtering rows. Add structural transformations as your data sources require them. Build the habit of naming queries and steps clearly from the very beginning. The investment in thorough Power Query preparation pays compounded returns across the entire life of a Power BI solution.
FAQ SECTION
Power Query is the data transformation and preparation tool built into Power BI. It connects to data sources, allows users to clean and reshape data through a visual interface, and loads the prepared data into the Power BI data model. Every transformation step is recorded automatically and runs on every scheduled data refresh.
What is the difference between Power Query and DAX?
Power Query transforms and cleans data before it loads into the Power BI data model — it handles tasks like removing duplicates, fixing data types, merging tables, and standardising values. DAX creates calculations and measures after the data is loaded. Power Query shapes the data; DAX analyses it. They operate at different stages and are not interchangeable.
Yes, for any serious Power BI work. Basic reports can be built from clean, well-structured data without using Power Query. However, real-world business data almost always requires cleaning and transformation before it is report-ready. Power Query is how that preparation happens reliably and automatically.
ETL stands for Extract, Transform, Load. In Power BI, Extract is connecting to a data source, Transform is cleaning and reshaping the data in Power Query, and Load is delivering the prepared data into the data model. Power Query is Power BI’s ETL engine.
The Power Query Editor is the interface inside Power BI Desktop where data transformation work is performed. It shows a live preview of the current state of each query and records every transformation as a documented, reversible step in the Applied Steps pane. Changes made in the editor generate M code automatically behind the scenes.
Query folding is when Power Query translates transformation steps into a native query that runs on the source database rather than processing the data locally. When query folding is active, the source database does the filtering and processing, which significantly improves refresh performance for large datasets. Certain transformation types break query folding, so it is worth preserving where possible on large database sources.
Merge combines two tables horizontally by matching rows on a common key column — similar to a SQL JOIN or Excel VLOOKUP. Append combines two tables vertically by stacking one table’s rows on top of another — similar to a SQL UNION. Merge adds columns from a second table; Append adds rows from a second table.
Yes. Power Query can connect to any number of data sources simultaneously. Each source gets its own query in the Queries pane. These individual queries can then be merged or appended to combine data from different sources into unified tables for the data model.
3 thoughts on “Power Query in Power BI Explained: A Beginner’s Guide to Data Transformation”