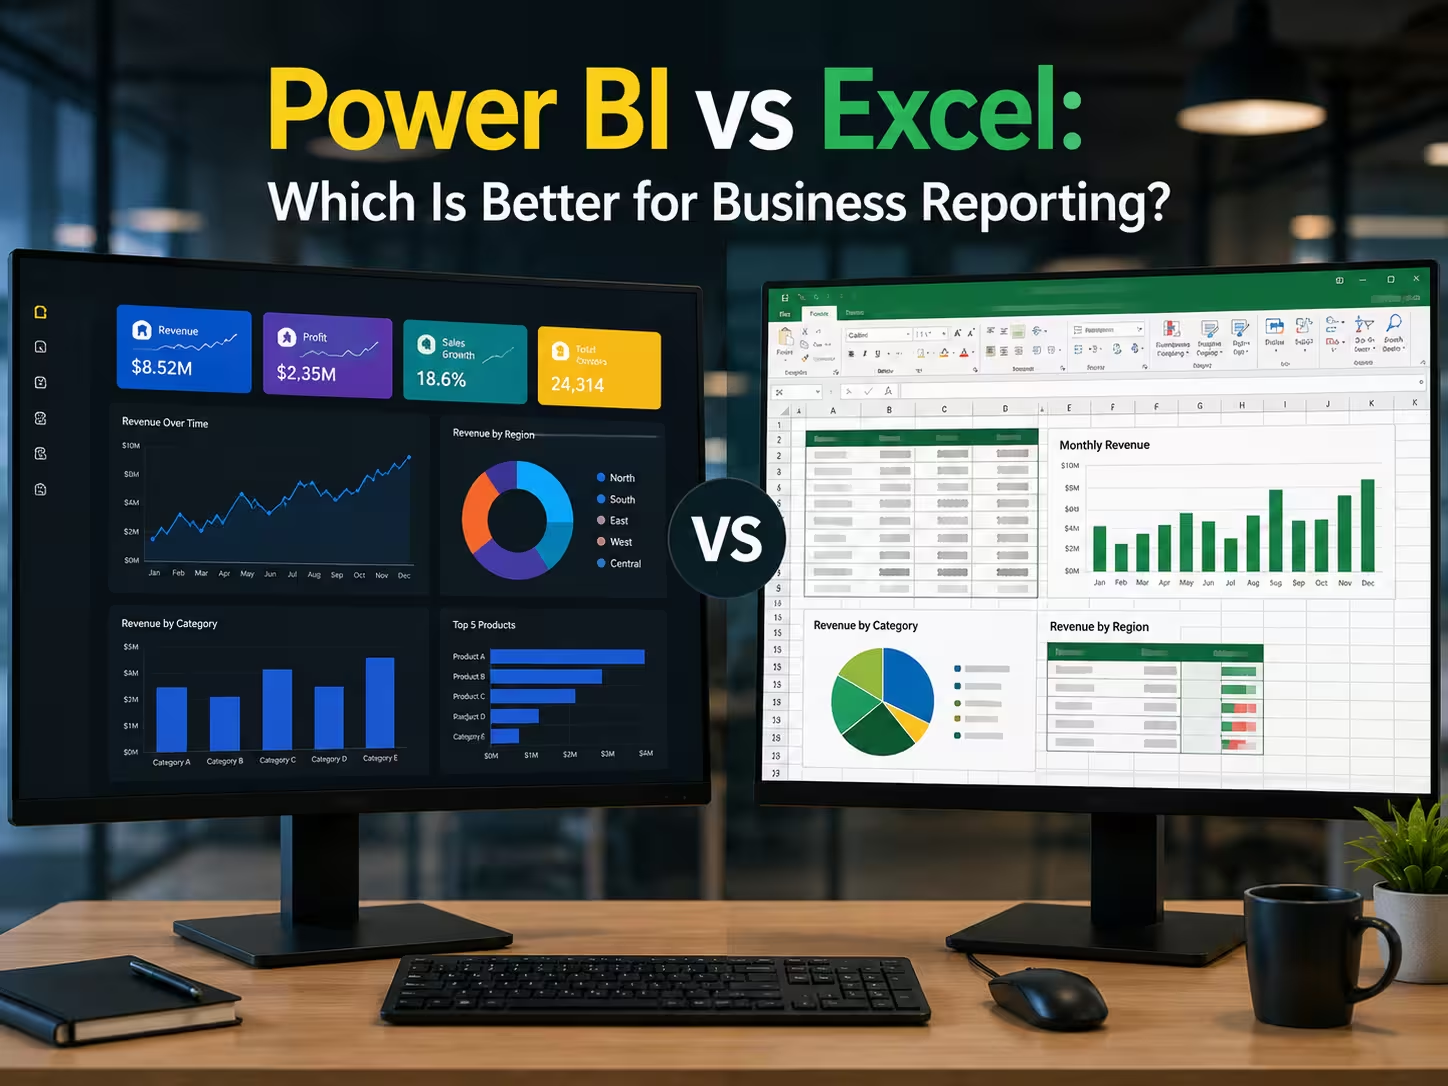
If you have ever built a monthly report in Excel carefully copying data between sheets, refreshing pivot tables, adjusting charts, and then emailing the finished file to ten colleagues you already understand the problem that Power BI was designed to solve. The question is not whether Excel has served business reporting well. It has, for decades. The real question is whether it is still the right tool for the demands your organization faces today.
The Power BI vs Excel debate comes up constantly among analysts, operations managers, and finance teams. This guide cuts through the noise and gives you a clear, practical answer one grounded in how both tools actually behave in real business environments, not just feature lists.
If you are completely new to Power BI, our guide What Is Power BI? Complete Beginner Guide for Business Reporting covers the platform from the ground up before you compare tools.
Understanding What Each Tool Was Built to Do
Before comparing capabilities, it is worth being precise about what each tool was designed for because Excel and Power BI are solving different problems, even when they appear to overlap.
Microsoft Excel: is a general-purpose spreadsheet application. It was built for calculation, flexible data entry, financial modelling, and ad hoc analysis. Its grid-based structure makes it extraordinarily versatile. A scientist, an accountant, a project manager, and a marketer can all open the same application and use it productively for completely different tasks.
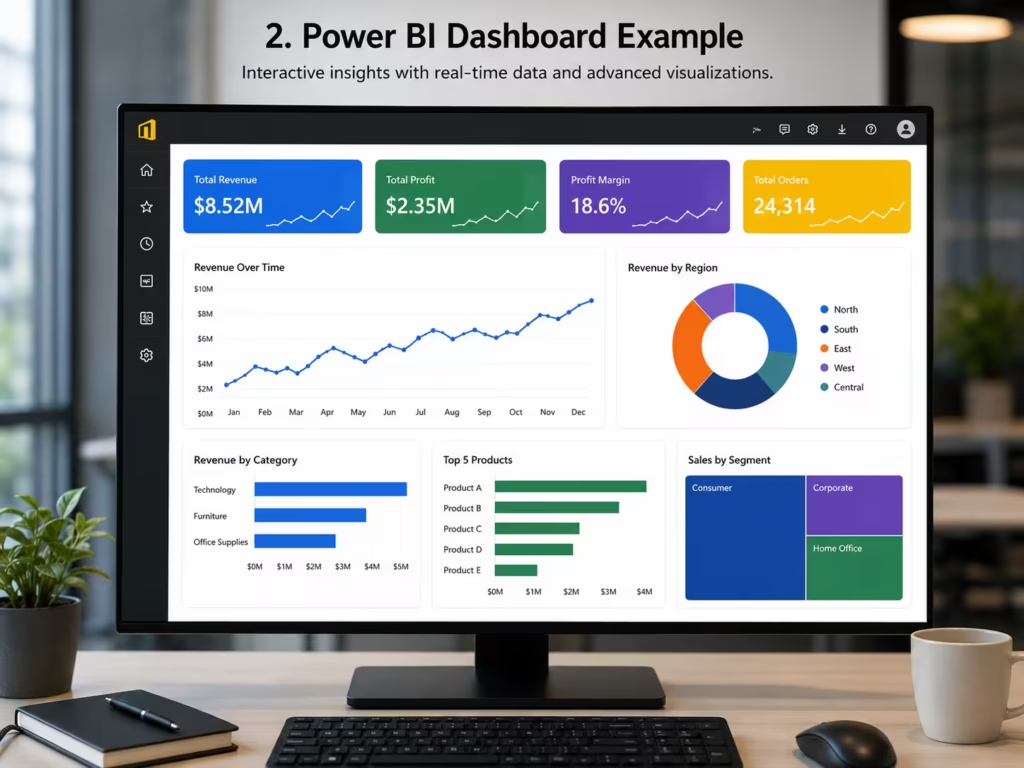
Microsoft Power BI: is a purpose-built business intelligence platform. It was designed specifically for connecting to data systems, modelling large structured datasets, and distributing interactive reports and dashboards across an organization. Every design decision in Power BI from Power Query to DAX to the Service exists to serve that specific mission.
This distinction matters because it reframes the comparison. You are not choosing between a good tool and a better tool. You are choosing which tool is the right fit for what you actually need to accomplish.
Head-to-Head Comparison: Power BI vs Excel
The table below covers the dimensions that matter most to business reporting teams. Each row reflects real-world operational behaviour, not marketing descriptions.
| Capability | Microsoft Excel | Power BI |
|---|---|---|
| Data volume limit | ~1 million rows per sheet | Hundreds of millions of rows with import mode |
| Data refresh | Manual, user-driven | Automated on schedule (hourly, daily, near real-time) |
| Multiple data source connection | Limited; complex to maintain | Native connectors to 200+ sources |
| Interactivity | Static; limited slicers | Fully interactive cross-filtering dashboards |
| Collaboration | File sharing via email or SharePoint | Live cloud workspace; simultaneous access |
| Version control | Difficult; prone to naming chaos | Managed centrally in the Power BI Service |
| Visualisation quality | Standard charts and graphs | Rich visual library including custom marketplace visuals |
| Data modelling depth | PivotTables, VLOOKUP, XLOOKUP | Relational star schema model with DAX measures |
| Report distribution | Manual email or file share | Published Apps, embedded reports, Teams integration |
| Row-level security | Not natively available | Built-in role-based data access control |
| AI and analytics features | Basic statistical functions | Anomaly detection, key influencers, smart narratives |
| Learning curve | Low — widely understood | Moderate — requires structured learning |
| Cost | Included in Microsoft 365 | Free desktop; Pro licence required for sharing |
| Audit trail | Limited | Dataset lineage, usage metrics, activity log |
Reading this table, it might seem like Power BI wins on every dimension. That conclusion would be too simple. Excel still holds genuine advantages in specific scenarios, and understanding those scenarios is what makes this comparison useful.
Where Excel Genuinely Outperforms Power BI
Excel’s longevity is not a matter of inertia alone. It remains the superior tool in several important situations.

Ad hoc financial modelling. When a CFO needs a what-if analysis built around a specific deal structure with custom formulas, scenario toggles, and flexible input cells. Excel is faster and more flexible than Power BI. The free-form grid allows financial models that would be cumbersome to replicate in a structured BI environment.
Small, one-off analyses. For a quick data exploration involving a few hundred rows and a single question, opening Power BI Desktop is unnecessary overhead. Excel handles this instantly.
Complex statistical calculations. Excel’s function library including statistical, engineering, and financial functions remains broader than what is natively available in DAX. Data scientists and actuaries routinely use Excel for calculations that Power BI cannot replicate without workarounds.
Data entry and input forms. Power BI is a read only reporting tool. It cannot accept user input into a dataset. If your workflow requires colleagues to enter or update data directly, Excel remains the practical choice.
Offline working environments. Power BI’s collaboration and sharing features rely on internet connectivity. In environments with restricted network access certain government agencies, clinical settings, or field operations. Excel’s offline capability is a genuine operational advantage.
Where Power BI Clearly Wins
With context established, the scenarios where Power BI creates a step-change improvement in reporting quality are equally clear.
Consolidating data from multiple systems. Excel can import data from different sources, but maintaining those connections reliably across multiple files, teams, and systems quickly becomes fragile. Power BI handles multi-source data consolidation as a core function, with refresh logic that runs without human intervention.
Reporting to large or diverse audiences. Distributing an Excel file to fifty people creates fifty separate versions of the truth. Power BI’s centralised publication model means every user sees the same data, refreshed from the same source, at the same time.
Enforcing data governance. In regulated environments particularly healthcare, financial services, and legal controlling who sees what data is not optional. Power BI’s row-level security and workspace permissions provide governance that spreadsheet-based reporting simply cannot match.
Eliminating repetitive manual work. If the same report is rebuilt weekly or monthly by an analyst copying, pasting, and reformatting data, that process is a candidate for automation. Power BI replaces that cycle with a model that runs automatically.
Scaling with business growth. A Power BI model built to handle ten thousand rows will handle ten million rows with configuration changes. An Excel based report built to handle a hundred thousand rows will start failing, slowly and then catastrophically, as data volumes grow.
The Decision Framework: Which Tool Should You Use?
Rather than a binary choice, the most useful question is: what does this specific task require?
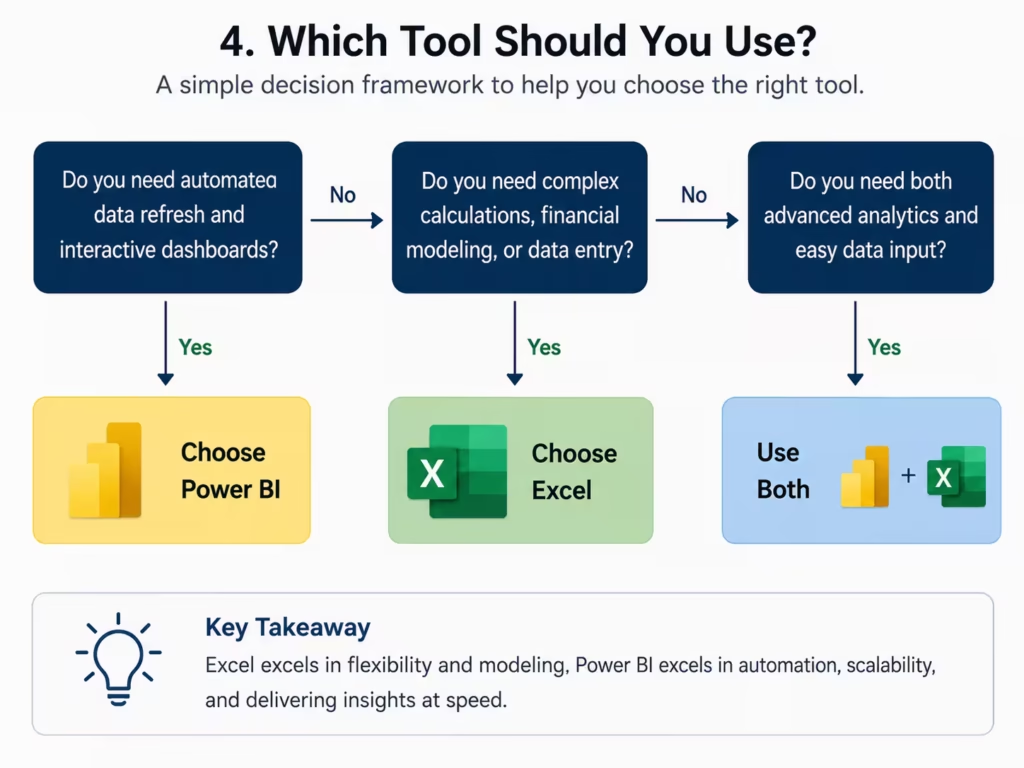
Use Excel when:
- You are doing financial modelling with scenario analysis
- The dataset is small and the question is one-off
- You need colleagues to input or edit data directly
- Complex statistical functions are required
- You are working offline or in a restricted network environment
Use Power BI when:
- You are connecting to two or more data systems simultaneously
- The report needs to refresh automatically without analyst involvement
- You are distributing reports to more than five or six people regularly
- Data governance and access control are business requirements
- You are managing datasets above 100,000 rows reliably
- Dashboards need to be available on mobile devices
Use both together when:
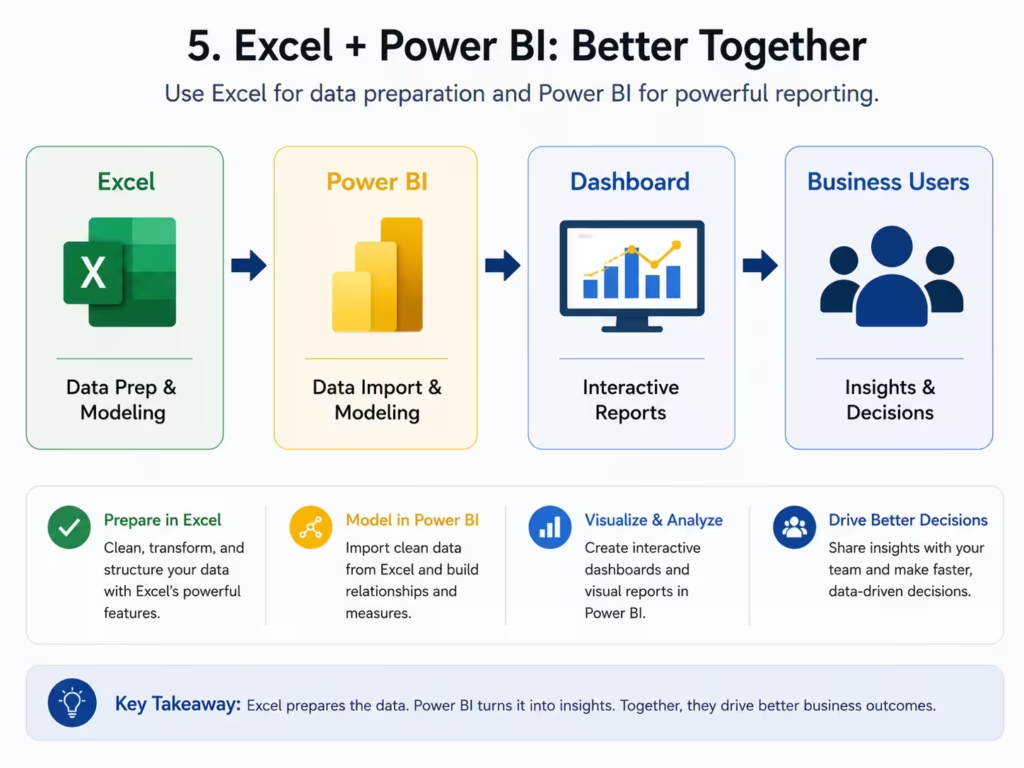
- Excel is used for modelling and manual inputs that feed into Power BI datasets
- Financial teams work in Excel for calculations but publish outputs to Power BI dashboards for executive visibility
- Analysts use Excel for exploratory work before formalising recurring reports in Power BI
This “both together” scenario is not a compromise, it is genuinely how mature data environments operate. The tools complement each other when each is used for what it does best.
Can Power BI and Excel Work Together?
Yes, and in practice this is one of the most important things to understand about the Power BI vs Excel question. Microsoft has built deliberate integration between the two tools.
Excel as a Power BI data source. Excel workbooks stored in SharePoint or OneDrive can be connected directly to Power BI as live data sources. When the Excel file is updated, the Power BI report refreshes automatically to reflect those changes.
Analysing in Excel. Power BI datasets can be explored through Excel’s familiar PivotTable interface using the “Analyse in Excel” feature. This allows analysts who are more comfortable in Excel to query a governed, centralised Power BI dataset without leaving the spreadsheet environment.
Power BI Publisher for Excel. Selected Excel ranges and charts can be pinned directly to Power BI dashboards. This creates a bridge where Excel-based outputs contribute to a broader Power BI reporting environment.
Export functionality. Report data from Power BI can be exported to Excel for further analysis when users need to perform calculations or manipulate the data in ways the report does not support.
These integrations mean that for most organizations, the right answer is not to replace Excel with Power BI but to identify which parts of the reporting workflow belong in each tool and build accordingly.
A Real-World Scenario: Finance Team Reporting
Consider a finance team that currently produces a monthly management accounts pack in Excel. The process involves:
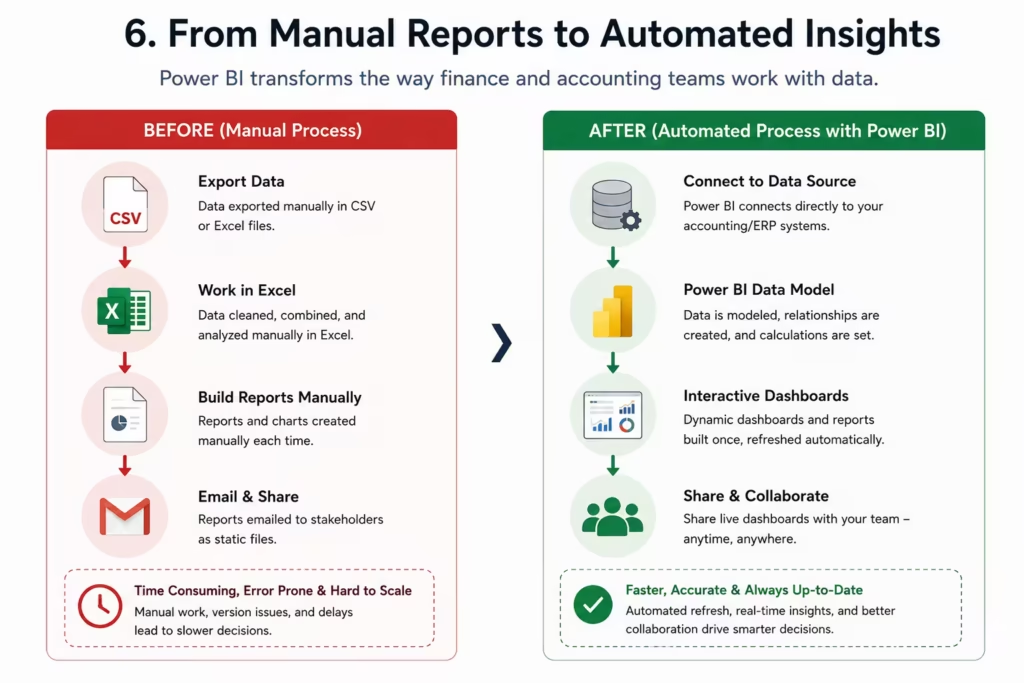
- Extracting data from an accounting system into CSV files
- Importing those files into a master Excel workbook
- Refreshing pivot tables and updating charts manually
- Formatting the output to match the standard template
- Emailing the finished file to twelve senior stakeholders
This entire workflow, from data extraction to distribution, takes two analysts approximately one and a half days each month.
In a Power BI environment, the same workflow looks like this:
- Power BI connects directly to the accounting system via a native connector
- A scheduled refresh runs automatically on the first working day of each month
- Stakeholders receive a notification that the report is ready
- Each stakeholder accesses the Power BI App and sees only the data relevant to their department
The output is more accurate, more consistent, and available in hours rather than days. The analysts redirect that reclaimed time toward actual financial analysis rather than data administration.
This is not a theoretical improvement. It reflects the operational reality of organisations that have made this transition — including those in healthcare administration, where the same manual reporting cycle creates identical problems at much higher stakes.
Common Mistakes When Comparing These Tools
Several misconceptions consistently lead organisations to make poor decisions about Excel and Power BI.
Assuming Power BI is only for large enterprises. Power BI Desktop is free. A small business with one analyst and modest data volumes can benefit from Power BI just as meaningfully as a multinational corporation.
Treating the switch as all-or-nothing. Organizations that try to migrate everything from Excel to Power BI simultaneously usually struggle. A phased approach starting with the most painful, most repetitive reporting process produces far better outcomes.
Underestimating Excel’s continuing relevance. Dismissing Excel as outdated is a mistake made by people who have not spent time in financial modelling or complex analytical environments. It remains an exceptional tool within its appropriate boundaries.
Judging Power BI by the quality of a poorly built report. A badly designed Power BI report one with no data model, cluttered visuals, and unfiltered raw data will perform poorly. This reflects poor implementation, not a limitation of the platform.
Ignoring the data quality question. Whichever tool you use, the accuracy of the output depends entirely on the quality of the input. Automating a report built on dirty data just produces wrong answers faster.
Excel Limitations That Drive Organizations Toward Power BI
Understanding Excel’s structural limitations helps explain why Power BI adoption accelerates in organisations once they hit a certain scale.
The row limit in Excel approximately one million rows per worksheet sounds large until you consider that a mid-sized retail business might generate two million transaction records in a single month. Excel’s calculation engine was not designed for relational data modelling. Building relationships between multiple large tables in Excel requires increasingly complex VLOOKUP or XLOOKUP formulas that are fragile, slow, and difficult to audit.
Collaboration in Excel has improved significantly with cloud-based co-authoring in Microsoft 365. However, managing a reporting process where multiple people contribute to a shared Excel file still creates version conflicts, formula errors, and governance gaps that compound over time.
Perhaps the most significant Excel limitation is visibility. When a report exists as a file emailed to stakeholders, there is no reliable way to know who has opened it, what version they are looking at, or whether the data it contains is current. Power BI’s centralised service solves all three of these problems by design.
Getting Started: Moving From Excel to Power BI
For organisations ready to begin transitioning reporting workflows from Excel to Power BI, the following approach reduces disruption and builds confidence progressively.
Start with one report. Choose the report that consumes the most analyst time and delivers the most business value. Build it in Power BI first. This creates a clear, measurable proof of value without disrupting the wider organisation.
Keep Excel for what it does well. Do not attempt to replace financial models or ad hoc analysis tools. Identify the recurring, structured reports weekly performance dashboards, monthly management accounts, operational KPI packs as the primary migration targets.
Invest in data quality before automation. Any data quality issues that exist in Excel-based reports will transfer to Power BI. Resolving them before building the Power BI model is significantly more efficient than cleaning them up afterward.
Use Microsoft Learn for structured skill development. Microsoft provides free, well-structured Power BI learning paths that take analysts from Excel familiarity to confident Power BI report building in a reasonable time investment.
Consider professional guidance for complex implementations. For organisations with complex data environments, multiple source systems, or strict governance requirements, working with an experienced Power BI implementation partner accelerates the transition and avoids costly architectural mistakes.
For a step-by-step introduction to building your first Power BI report, see our [Power BI Beginner’s Dashboard Guide] — coming soon in the Zytriona learning series.
Conclusion: The Right Tool for the Right Job
Power BI and Excel are both excellent tools. The organisations that get the most value from both are the ones that understand what each is genuinely designed to do.
If your business is still running critical reporting processes through manually refreshed spreadsheets distributed by email, Power BI represents a meaningful and accessible upgrade. The time savings are real. The accuracy improvements are real. The governance benefits are real.
If your team does complex financial modelling, builds bespoke analytical tools, or works in environments where data entry is part of the reporting workflow, Excel remains indispensable.
For most business teams, the answer to “Power BI or Excel?” is simply: both — each doing what it does best, working together where the integration adds value.
The next step in building your business intelligence capability is understanding the DAX formula language that powers Power BI’s analytical depth. Our [Beginner’s Guide to DAX in Power BI] covers the fundamentals you need to move beyond basic reports.
FAQ SECTION
Excel is a general-purpose spreadsheet tool designed for flexible data entry, calculation, and financial modelling. Power BI is a dedicated business intelligence platform designed for connecting to multiple data sources, automating report refresh, and distributing interactive dashboards across an organisation. They serve different primary purposes and work best when used together.
Power BI cannot replace Excel entirely because it does not support direct data entry, complex financial modelling formulas, or offline use in the same way Excel does. Power BI replaces the recurring, structured reporting workflows that are currently handled in Excel — particularly those involving multiple data sources, large datasets, and broad distribution to stakeholders.
For recurring, structured business reporting with automated refresh and broad distribution, Power BI is the superior tool. For ad hoc analysis, financial modelling, and small one-off tasks, Excel remains more practical. The most effective business reporting environments use both tools in combination.
Yes. Power BI connects directly to Excel workbooks as data sources, allows Power BI datasets to be analysed through Excel PivotTables using the “Analyse in Excel” feature, and supports exporting Power BI report data back to Excel for further analysis. The two tools are designed to integrate, not compete.
Excel has a lower initial learning curve because most business users already have familiarity with it. Power BI requires more structured learning to use effectively, particularly around data modelling and DAX formulas. However, analysts with Excel experience typically find Power BI’s concepts intuitive once they begin structured training.
A business should consider moving reporting workflows to Power BI when: analysts are spending significant time manually refreshing and reformatting reports; data volumes regularly exceed Excel’s practical limits; reports need to be shared reliably with more than a handful of people; or data governance and access control become business requirements.
Power BI Desktop is free to download and use for building reports. The Power BI Service, which enables sharing and collaboration, requires a Power BI Pro license. Excel is included in Microsoft 365 subscriptions. For organizations already licensed on Microsoft 365, Power BI Pro is often available as an add-on at modest additional cost.
1 thought on “Power BI vs Excel: Which Is Better for Business Reporting?”