
Most organizations are drowning in data and starving for insight. Spreadsheets grow unwieldy. Reports take hours to build. Decisions get made on yesterday’s numbers. Power BI was designed to fix exactly that and it has become the tool of choice for tens of thousands of businesses worldwide who want to turn raw data into clear, actionable intelligence.
Whether you are an analyst stepping into business intelligence for the first time, an operations manager looking to replace manual reporting, or a healthcare administrator who needs reliable dashboards without relying entirely on your IT department, this guide gives you a complete, honest picture of what Power BI is, how it works, and whether it is the right fit for your organization.
What Is Power BI?
Power BI is a business intelligence and data visualization platform developed by Microsoft. It enables individuals and teams to connect to data sources, clean and model that data, and then visualize it through interactive dashboards and reports all without writing a single line of code in most cases.
At its core, Power BI answers a fundamental business problem: how do you take raw data from multiple systems and turn it into something that a decision-maker can actually use within minutes, not hours?
The platform sits within the broader Microsoft Power Platform ecosystem, alongside Power Apps, Power Automate, and Power Pages. This integration means Power BI does not operate in isolation. it feeds from and contributes to a connected suite of modern enterprise tools.
Microsoft describes Power BI as a collection of software services, apps, and connectors that work together to turn your unrelated sources of data into coherent, visually immersive, and interactive insights.
The Three Core Components of Power BI
Understanding Power BI properly means understanding how its three main components relate to each other.

Power BI Desktop:
This is the free Windows application where most of the analytical work happens. You use Power BI Desktop to connect to data sources, transform data using Power Query, build data models using DAX (Data Analysis Expressions), and design your reports and visualizations. Think of it as the construction environment. Where the actual report-building takes place.
Power BI Service:
Also known as app.powerbi.com, the Power BI Service is the cloud-based platform where you publish, share, and collaborate on reports and dashboards. This is where end users. Your finance team, operations managers, or executives go to view and interact with the reports you have built.
Power BI Mobile:
Power BI Mobile apps for iOS and Android allow users to view dashboards and reports on smartphones and tablets. While limited in terms of authoring capability, this component ensures that business intelligence is accessible from anywhere a critical feature for field teams, executives, and remote workforces.
How Does Power BI Work? A Step by Step Overview
For anyone new to business intelligence tools, the workflow inside Power BI follows a logical sequence that mirrors how good analysts already think.
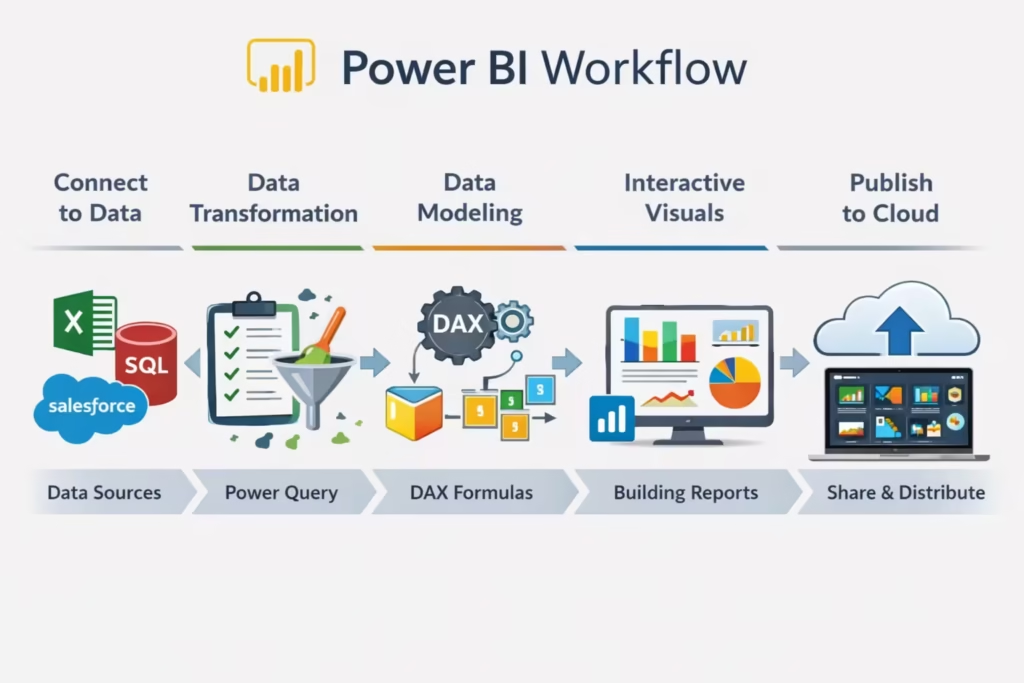
Step 1. Connect to Your Data: Power BI can connect to hundreds of data sources out of the box. These include Microsoft Excel workbooks, SQL Server databases, SharePoint lists, Salesforce, Google Analytics, Azure services, and many more. In healthcare contexts, connections to clinical data systems and Electronic Health Record exports are also supported.
Step 2. Transform and Clean the Data: Raw data is rarely in a usable state. Power Query, the data preparation engine inside Power BI, allows you to filter rows, rename columns, merge tables, remove duplicates, and handle missing values. All through a visual interface that records every step as a reproducible query.
Step 3. Model the Data: Once your data is clean, you define relationships between tables and write calculated measures using DAX. This is where Power BI gains serious analytical power. DAX allows you to create metrics that are far more sophisticated than anything achievable with Excel formulas.
Step 4. Build Visualizations: With a model in place, you drag and drop visual elements bar charts, line graphs, maps, KPI cards, tables, slicers onto a report canvas. Each visual is interactive; clicking one element automatically filters the others on the page.
Step 5. Publish and Share Reports are published from Power BI Desktop to the Power BI Service, where they can be shared with colleagues, embedded in internal portals, or distributed through Power BI Apps to larger audiences. Scheduled data refreshes keep your reports up to date automatically.
Key Features That Make Power BI a Leading Business Intelligence Tool
Power BI’s popularity is not accidental. The platform combines a feature set that addresses real operational problems businesses face daily.

Natural Language Q&A: Users can type questions in plain English “What were total sales in March by region?” and Power BI generates a relevant visualization automatically. This removes barriers for non-technical users who need answers quickly.
Automated Data Refresh: Once connected and configured, datasets in the Power BI Service can refresh automatically on a schedule hourly, daily, or in near real time using DirectQuery. Reports never need to be manually rebuilt.
Row-Level Security: Different users see different data based on their role. A regional sales manager sees only their region’s figures; a finance director sees everything. This is managed through row-level security rules built into the data model.
Custom Visuals Marketplace: Beyond the standard visual library, Power BI has a marketplace of hundreds of certified custom visuals from Gantt charts to advanced statistical plots that extend what your reports can display.
Integration with Microsoft 365: Power BI reports embed directly into Microsoft Teams channels, SharePoint sites, and PowerPoint presentations. For organizations already running on Microsoft infrastructure, this integration alone eliminates many legacy reporting bottlenecks.
AI-Powered Insights: Power BI includes built-in artificial intelligence features such as anomaly detection, key influencer analysis, smart narratives, and decomposition trees. These tools help surface patterns in data that might otherwise go unnoticed.
Power BI vs Excel: Understanding the Difference
This comparison comes up constantly among business users, and for good reason. Excel has been the default business reporting tool for decades.
Understanding where Power BI improves on it and where Excel still has its place saves organizations from making poor tool choices.
| Capability | Microsoft Excel | Power BI |
|---|---|---|
| Data volume | Millions of rows (with limits) | Hundreds of millions of rows |
| Data refresh | Manual | Automated on schedule |
| Interactivity | Limited | Fully interactive dashboards |
| Collaboration | File-sharing dependent | Cloud-based, live sharing |
| Data modelling | PivotTables, VLOOKUP | Advanced relational model with DAX |
| Visualisation | Charts and graphs | Rich, interactive visual library |
| Version control | Challenging | Managed through the Service |
| Learning curve | Low | Moderate |
| Cost | Included in Microsoft 365 | Free desktop, Service requires licence |
The honest answer is that Excel and Power BI are not direct competitors they serve different phases of the analytical workflow. Excel remains excellent for ad hoc calculations, small datasets, and financial modelling. Power BI is the right choice when you need to consolidate multiple data sources, automate reporting, and deliver insights to a wider audience at scale.
For teams transitioning from Excel-heavy reporting environments,In many operational environments, especially in healthcare and equipment management workflows, reporting delays often happen because teams rely on disconnected spreadsheets maintained manually by different departments. One of the immediate benefits Power BI provides is creating a centralized reporting layer where stakeholders work from the same live dataset instead of multiple spreadsheet versions.
Who Uses Power BI? Real-World Business Scenarios
Power BI is not a niche enterprise tool. Its adoption spans industries and roles, which is a direct result of how accessible its interface is relative to the analytical depth it offers.
Finance Teams: Finance departments use Power BI to build monthly management accounts, budget vs actuals reports, cash flow dashboards, and variance analysis tools. Rather than spending days consolidating spreadsheets, analysts build self-refreshing models that produce the same output in minutes.
Sales and Operations: Sales leaders monitor pipeline health, conversion rates, and territory performance through live dashboards connected directly to CRM systems. Operations teams track production efficiency, logistics performance, and supply chain KPIs without waiting for weekly batch reports.
Healthcare Administrators: In healthcare settings, Power BI is increasingly used to monitor patient throughput, bed occupancy, appointment waiting times, staff utilisation, and clinical outcomes. The ability to connect to diverse data systems while maintaining role-based data security makes it particularly well-suited to regulated healthcare environments where data governance is non-negotiable.
Human Resources: HR teams build workforce analytics dashboards covering headcount trends, attrition rates, recruitment pipeline metrics, and training completion rates. Data that previously lived in multiple HR systems becomes a single consolidated view.
IT and Technology Teams: Infrastructure teams use Power BI to monitor system performance, incident volumes, service desk metrics, and project delivery status. Connecting to Azure Monitor, Jira, or ServiceNow datasets gives technology leaders real-time operational visibility.
Common Beginner Mistakes When Starting with Power BI
No beginner guide would be complete without addressing the pitfalls that slow most new users down. Avoiding these from the start saves significant rework later.
Skipping the data modelling step. Many beginners drag data directly into visuals without building a proper data model. This works for simple reports but creates serious problems as requirements grow. Taking time to define relationships and build a clean star schema pays dividends immediately.
Building on unclean data. The accuracy of every report depends entirely on the quality of the underlying data. Using Power Query to validate, clean, and standardise data before modelling is not optional — it is foundational.
Overcomplicating report design. A dashboard packed with twenty visuals communicates nothing clearly. Effective Power BI reports are focused, designed around specific questions, and avoid visual noise. Less is almost always more.
Ignoring performance optimisation. Large datasets with poorly written DAX measures or too many calculated columns can make reports feel slow and unresponsive. Learning basic performance best practices early prevents frustration as your data volumes grow.
Not using the Power BI Service for sharing. Sharing .pbix files directly via email creates version control chaos and prevents real-time collaboration. Publishing to the Service and sharing via workspaces or Apps is the correct approach.
Power BI Licensing: What You Actually Need
Understanding the licence model helps organisations plan costs accurately.
Power BI Desktop is completely free to download and use. There are no restrictions on its analytical capabilities.
Power BI Pro is required for publishing, sharing, and collaborating in the Power BI Service. At the time of writing, Pro licences are available per user per month and are often included in Microsoft 365 E3 and E5 enterprise agreements.
Power BI Premium offers dedicated cloud capacity, meaning reports can be shared with users who do not hold individual Pro licences. Premium is suited to larger organisations that need to distribute reports broadly without licensing every viewer.
Power BI Embedded is the developer-focused option for organisations building Power BI visuals directly into their own applications and customer-facing portals.
For most small and medium-sized organisations, Power BI Pro is the practical starting point.
Getting Started with Power BI: Practical First Steps
If you are ready to begin your Power BI journey, the following sequence gives you the most efficient path from zero to your first working report.
- Download Power BI Desktop from the official Microsoft website. it is free and takes minutes to install.
- Connect to a data source you already understand. Start with a familiar Excel file or a simple database.
- Spend time in Power Query cleaning your data before touching any visuals.
- Build one simple table relationship before moving to visualisations.
- Create three to five focused visuals that answer a specific business question.
- Add slicers to make your report interactive.
- Publish to the Power BI Service and view your report in a browser.
Microsoft Learn provides free structured learning paths for Power BI that progress logically from beginner to advanced. Supplementing self-directed learning with structured courses accelerates the journey considerably.
Power BI and Reporting Automation
One of the most operationally significant capabilities of Power BI is its ability to eliminate manual reporting cycles entirely. When configured correctly, a Power BI solution can connect to live data systems, refresh on a defined schedule, and deliver updated dashboards to stakeholders without any human intervention.
This is not simply a convenience feature. In organisations where analysts spend twenty to thirty percent of their working week refreshing and reformatting reports, automating that process frees skilled people to do analytical work rather than data administration.
Combined with Power Automate another component of the Microsoft Power Platform — Power BI can trigger alerts when data crosses defined thresholds, send report snapshots by email on a schedule, and initiate downstream workflows based on data conditions. This is where business intelligence moves from passive reporting into active operational intelligence.
Conclusion: Is Power BI Right for Your Organization?
Power BI has earned its position as the leading business intelligence platform for a straightforward reason: it delivers genuine analytical capability without requiring a team of data engineers to operate it.
For organisations that are currently managing business reporting through a collection of spreadsheets, manual extracts, and email distributions, Power BI represents a meaningful operational improvement. Reports become faster to produce, more accurate, and far easier to share. Decision-makers get better information. Analysts reclaim time.
The platform does require investment in learning, in data quality, and in thoughtful design. But the return on that investment, measured in time saved and decisions improved, is well-documented across every industry where it has been adopted.
If your organization is at the beginning of its business intelligence journey, Power BI is the most sensible starting point available today. The path from your first connected dataset to a fully automated reporting environment is more accessible than it has ever been.
FAQ SECTION
A Power BI dashboard is a single-page view of the most important metrics and visualisations from one or more underlying reports. Dashboards in the Power BI Service are designed for at-a-glance monitoring and can be pinned with the most critical KPIs a team or executive needs to track daily.
Power BI has a manageable learning curve for beginners, particularly those already familiar with Excel. Basic reporting and dashboard creation can be learned within a few weeks through free resources including Microsoft Learn. Advanced features such as DAX formula writing and data model optimisation require more dedicated study.
Power BI connects to hundreds of data sources including Microsoft Excel, SQL Server, SharePoint, Azure services, Salesforce, Google Analytics, Oracle databases, PostgreSQL, SAP, and many more through both native connectors and a generic API framework.
For many organizations, Power BI can replace legacy reporting tools and manual spreadsheet-based reporting. It provides automated data refresh, interactive visualizations, and centralized distribution that most traditional reporting approaches cannot match at comparable cost or speed.
Power BI is used for connecting to business data sources, transforming and modelling that data, and creating interactive dashboards and reports that help organizations monitor performance and make informed decisions. It is used across industries including finance, operations, healthcare, sales, and human resources.
Power BI Desktop the application used to build reports — is completely free to download and use. Sharing and collaborating through the Power BI Service requires a Power BI Pro licence, which is available as a paid monthly subscription or often included in certain Microsoft 365 enterprise plans.
Excel is a general-purpose spreadsheet tool suited to ad hoc calculations and small dataset analysis. Power BI is a dedicated business intelligence platform designed for large-scale data modelling, automated reporting, and interactive dashboards shared across an organization. Both tools are often used together in modern data environments.
2 thoughts on “What Is Power BI? Complete Beginner Guide for Business Reporting”